Provisional Real-Time Data Graphs and Other Data Products
Real-time Meteorological Stations
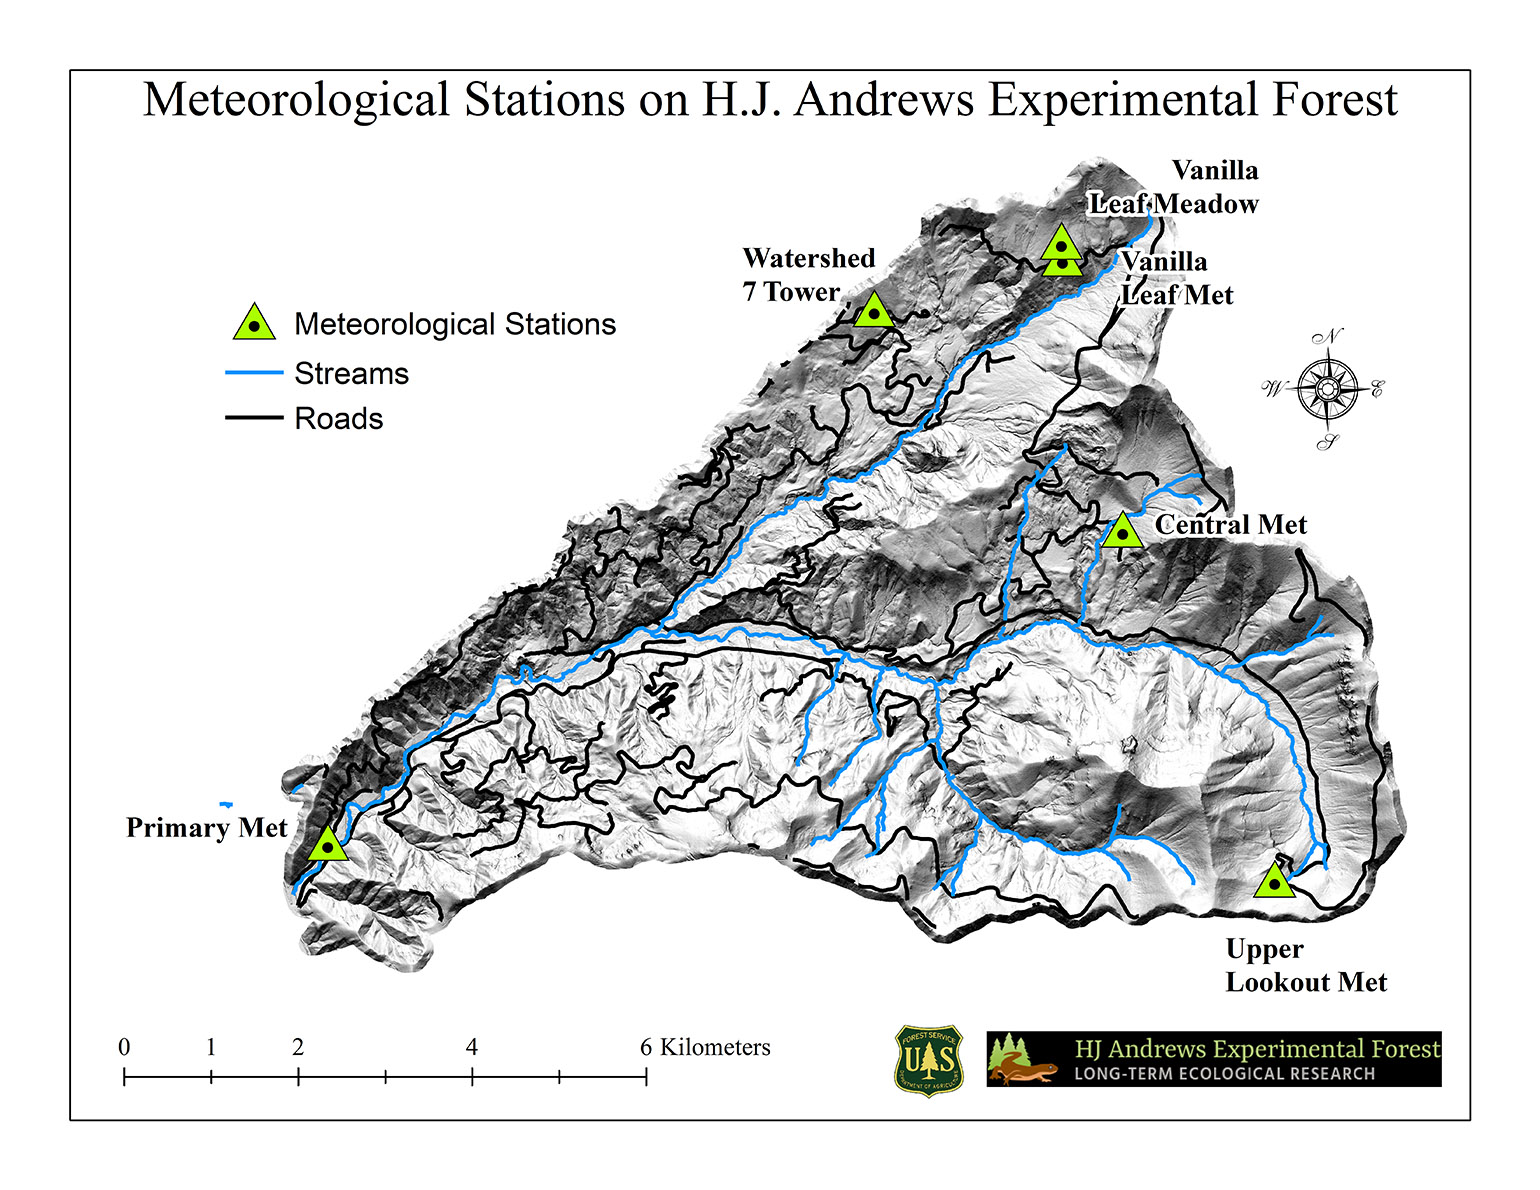
Meteorological Stations A three-level hydro-climatological network for data monitoring was established in 1994. The networks at each level are nested to form a coordinated program of data acquisition and measurement. The first-level in this top-down approach consists of Benchmark Meteorological Stations (BMS). The BMS are designed to represent the environment across the Andrews. These stations are intended to provide complete, long-term, high temporal resolution, meso-scale hydroclimatological data. The location of the BMS network is based on factors such as elevation, aspect, vegetation gradients, and accessibility. Collected meteorological parameters are generally standardized across the BMS as well as methods and instrumentation.
Secondary Meteorological Stations also follow standardized methods and serve similar purposes but are somewhat limited in meteorological parameters collected. Secondary stations are not included in the real-time network processes.
Real-time Stream Gauging Stations
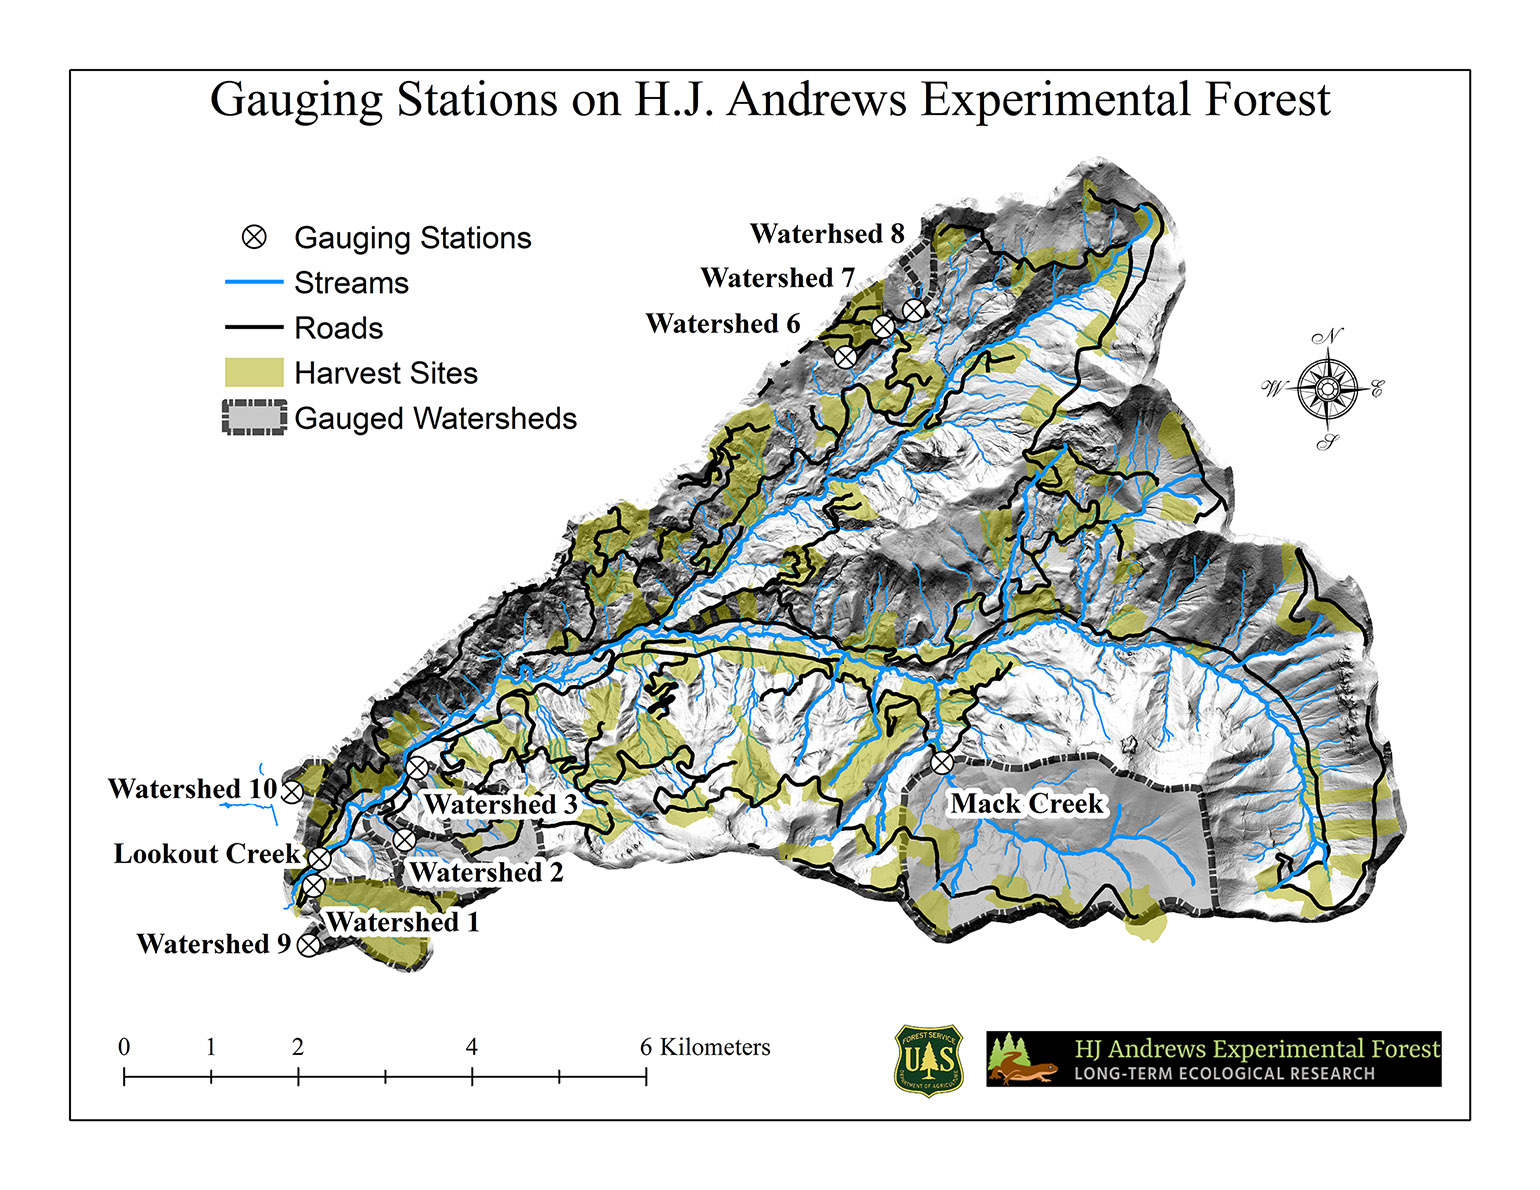
Small Watersheds stream temperature and air temperature above the stream are measured at all stream gauge sites and at selected major stream confluences. Current temperature data are collected as 5min averages of instantaneous measurements. These data began ~1996.
Real-time Data Maps
The Andrews Forest maintains several Real-time Data Maps to provide users a sense of location for each of our real-time data streams. Below is a list to direct links (Note: they will direct users away from the andrewsforest.oregonstate.edu website).
Provisional Data
Provisional data includes a browsable list of datasets and plots from federal and HJA-affiliated monitoring programs operating near the Andrews Forest, Blue River, Oregon, USA. These are provisional data that have not been completely quality checked. These data will change.
Real-time Station Diagnostics
Meteorological and stream gauging station diagnostics feature need-based visualizations and criteria based notifications that assist researcher and technicians to improve the quality of the data streaming from remote monitoring stations.