
Image Search
| Thumbnail | Media name | Gallery | Keyword Tags | Caption | Photographed date Sort ascending |
|---|---|---|---|---|---|
|
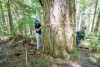
aer_054.jpg | Forests of Oregon Elevation Gradient (FOREG) 2019 | Joseph LaManna and Emily Dewald-Wang measure the diamater of a large Douglas fir tree. |
||
|
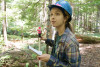
aer_056.jpg | Forests of Oregon Elevation Gradient (FOREG) 2019 | Emily Dewald-Wang recording location, species, and condition of a tree within a forest dynamics plot. |
||
|
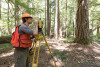
aer_057.jpg | Forests of Oregon Elevation Gradient (FOREG) 2019 | Adam Milenkowic uses the laser survey tool (total station) to measure the exact location of each stem within the plot |
||
|
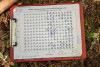
aer_058.jpg | Forests of Oregon Elevation Gradient (FOREG) 2019 | A map of a 12-ha section of FOREG-31 (the megaplot, with a footprint of 25 ha), showing the reference poles from which the total station maps trees and stems. The diagonal-square on the right side of the map is historic Reference Stand 31. |
||
|
aer_059.jpg | Forests of Oregon Elevation Gradient (FOREG) 2019 | Adam Milenkowic uses the laser survey tool (total station) to measure exact location of each stem within the plot. Data, called out from a person moving from tree to tree, is recorded in the tablet. |
||
|
aer_060.jpg | Forests of Oregon Elevation Gradient (FOREG) 2019 | Adam Carson sets up the target for the laser survey tool (total station). |
||
|
aer_061.jpg | Forests of Oregon Elevation Gradient (FOREG) 2019 | Adam Carson paints an orange ring around a stem to mark measurement height for future censuses. |
||
|
aer_062.jpg | Forests of Oregon Elevation Gradient (FOREG) 2019 | Aaron Nelson looks over a 1m square plot within the larger plot FOREG 31 |
||
|
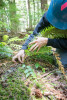
aer_063.jpg | Forests of Oregon Elevation Gradient (FOREG) 2019 | Aaron Nelson displays one of the metal identification tags that is placed around each stem within the 1m square plot |
||
|
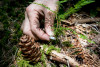
aer_064.jpg | Forests of Oregon Elevation Gradient (FOREG) 2019 | A metal identification tag, with a unique number, is placed around each stem within each 1m-square plot. Each plant is noted for species, size, location, and will be tracked for years to come. |
||
|
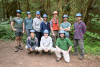
aer_001.jpg | Forests of Oregon Elevation Gradient (FOREG) 2019 | The FOREG crew: (back row:) Matt Reala, Maggie Ross, Maddie Sutton, Ethan Torres, Adam Milenkowic, Aaron Nelson, Adam Carson, (front row:) Emily Dewald-Wang, Liam Engel, Joseph LaManna |
||
|
aer_002.jpg | Forests of Oregon Elevation Gradient (FOREG) 2019 | Some of the tools for big plot work: measuring stick, calipers, pliers, nails |
||
|
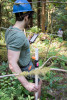
aer_019.jpg | Forests of Oregon Elevation Gradient (FOREG) 2019 | Matt Reala holds a PVC pipe with reflective target and rod level, used as the target for the laser survey tool (total station) in mapping stem distance and location |
||
|
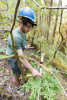
aer_020.jpg | Forests of Oregon Elevation Gradient (FOREG) 2019 | Matt Reala holds a PVC pipe with reflective target and rod level, used as the target for the laser survey tool (total station) in mapping stem distance and location |
||
|
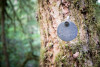
aer_021.jpg | Forests of Oregon Elevation Gradient (FOREG) 2019 | A tree tag, specific to the FOREG study, which provides a unique identifcation number to each tree or large shrub in the plot. This tag is on a western hemlock. |
||
|
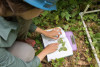
aer_037.jpg | Forests of Oregon Elevation Gradient (FOREG) 2019 | Maggie Ross verifies the identification of a plant using her reference guide |
||
|
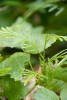
aer_038.jpg | Forests of Oregon Elevation Gradient (FOREG) 2019 | In the center is a small seedling of a cedar tree |
||
|
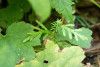
aer_039.jpg | Forests of Oregon Elevation Gradient (FOREG) 2019 | In the center is a small seedling of a cedar tree. Note how the type of leaf changes from main stem to lateral leaves. |
||
|
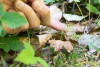
aer_040.jpg | Forests of Oregon Elevation Gradient (FOREG) 2019 | A very small seedling of western hemlock. Each seedling is noted, recorded, measured, and tagged. |
||
|
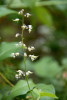
aer_041.jpg | Forests of Oregon Elevation Gradient (FOREG) 2019 | A flower of a tiarella plant within the 1m-square plot |
||
|
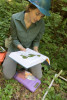
aer_042.jpg | Forests of Oregon Elevation Gradient (FOREG) 2019 | Maggie Ross verifies the identification of a plant using her reference guide |
||
|
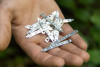
aer_043.jpg | Forests of Oregon Elevation Gradient (FOREG) 2019 | Metal identification tags used to wrap around the stem of each plant within a 1m-square plot |
||
|
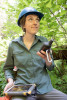
aer_044.jpg | Forests of Oregon Elevation Gradient (FOREG) 2019 | Maggie Ross uses a GPS to mark the exact location of the new 1m-squared plot |
||
|
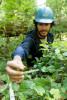
aer_046.jpg | Forests of Oregon Elevation Gradient (FOREG) 2019 | Ethan Torres notes each plant within the 1m square plot |
||
|
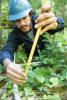
aer_047.jpg | Forests of Oregon Elevation Gradient (FOREG) 2019 | Ethan Torres measures the height of a seedling |
||
|
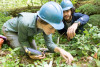
aer_048.jpg | Forests of Oregon Elevation Gradient (FOREG) 2019 | Maggie Ross and Ethan Torres identify, measure, and record each plant within the 1m square plot |
||
|
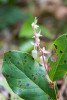
aer_049.jpg | Forests of Oregon Elevation Gradient (FOREG) 2019 | A close up of salal (Gaultheria shallon) |
||
|
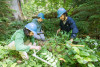
aer_050.jpg | Forests of Oregon Elevation Gradient (FOREG) 2019 | Joseph LaManna, Maggie Ross, and Ethan Torres survey every plant within their 1m square plot |
||
|
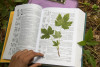
aer_036.jpg | Forests of Oregon Elevation Gradient (FOREG) 2019 | Maggie Ross verifies the identification of a plant (maple-leaf currant) using her reference guide |
||
|
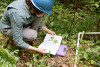
aer_035.jpg | Forests of Oregon Elevation Gradient (FOREG) 2019 | Maggie Ross verifies the identification of a plant using her reference guide |
||
|
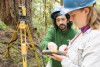
aer_022.jpg | Forests of Oregon Elevation Gradient (FOREG) 2019 | Joseph LaManna (left) and Maddie Sutton (right) measure and record data on plant size and location |
||
|
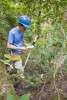
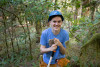
aer_023.jpg | Forests of Oregon Elevation Gradient (FOREG) 2019 | Liam Engel fact checks plants within the plot, to verify data recorded the day prior |
||
|
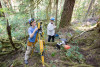
aer_024.jpg | Forests of Oregon Elevation Gradient (FOREG) 2019 | Liam Engel locates trees that will then be mapped with the laser survey tool (total station) |
||
|
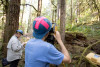
aer_025.jpg | Forests of Oregon Elevation Gradient (FOREG) 2019 | Liam Engel (left) and Maggie Sutton (right) measure and record data on every plant with a stem diameter larger than 1 cm |
||
|
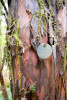
aer_026.jpg | Forests of Oregon Elevation Gradient (FOREG) 2019 | Using the laser survey tool to map exact location of each stem |
||
|
aer_027.jpg | Forests of Oregon Elevation Gradient (FOREG) 2019 | A tree tag, specific to the FOREG study, which provides a unique identifcation number to each tree or large shrub in the plot. This tag is on a Pacific yew tree. |
||
|
aer_028.jpg | Forests of Oregon Elevation Gradient (FOREG) 2019 | Joseph Lamanna (left) and undergraduate student Ethan Torres pick up supplies they'll need for establishing 1m-square vegetation survey plots |
||
|
aer_029.jpg | Forests of Oregon Elevation Gradient (FOREG) 2019 | Field crew co-lead Maggie Ross uses a GPS to locate the next 1m-square plot |
||
|
aer_030.jpg | Forests of Oregon Elevation Gradient (FOREG) 2019 | Vegetation | Joseph LaManna and Maggie Ross move through the forest to the next survey plot |
|
|
aer_031.jpg | Forests of Oregon Elevation Gradient (FOREG) 2019 | A view within plot FOREG38, which contains Reference Stand 38. |
||
|
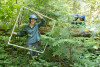
aer_032.jpg | Forests of Oregon Elevation Gradient (FOREG) 2019 | Maggie Ross holds up the frame of the 1m-square. It will be laid down over the ground vegetation, and everything within the frame will be inventoried and recorded |
||
|
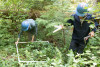
aer_033.jpg | Forests of Oregon Elevation Gradient (FOREG) 2019 | Laying down the 1m-square frame over the ground vegetation. Everything within the frame will be inventoried and recorded |
||
|
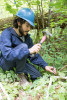
aer_034.jpg | Forests of Oregon Elevation Gradient (FOREG) 2019 | Hammering rebar to anchor the corners of the 1-m square plots. The corners will be flagged and their locations marked with GPS. The plots will be revisited for years to come. |
||
|
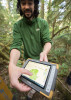
aer_009.jpg | Forests of Oregon Elevation Gradient (FOREG) 2019 | Joseph LaManna shows data from this plot, FOREG02, which contains old Reference Stand 2. The data show every mapped stem and the underlying topography. |
||
|
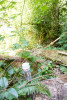
aet_048.jpg | Hydrology Field Work 2019 | Hydrology | Wells in Watershed 01 at the Andrews Forest. The wells are used to sample the water deep in the streambed material |
|
|
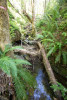
aet_052.jpg | Hydrology Field Work 2019 | Hydrology | the stream in Watershed 01 in the HJ Andrews Experimental Forest LTER site |
|
|
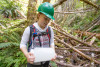
aet_041.jpg | Hydrology Field Work 2019 | Hydrology | Indiana University graduate student, Paige Becker, conducts salt tracer experiments in Watershed 01 |
|
|
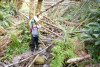
aet_042.jpg | Hydrology Field Work 2019 | Hydrology | Indiana University graduate student, Paige Becker, conducts salt tracer experiments in Watershed 01 |
|
|
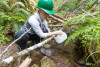
aet_043.jpg | Hydrology Field Work 2019 | Hydrology | Indiana University graduate student, Paige Becker, conducts salt tracer experiments in Watershed 01 |
|
|
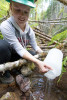
aet_044.jpg | Hydrology Field Work 2019 | Hydrology | Indiana University graduate student, Paige Becker, conducts salt tracer experiments in Watershed 01 |
|
|
aet_045.jpg | Hydrology Field Work 2019 | Wells in Watershed 01 at the Andrews Forest. The wells are used to sample the water deep in the streambed material |
||
|
aet_046.jpg | Hydrology Field Work 2019 | Graduate student, Paige Becker, points out a water well in the soil. The well had been placed originally in the center of the streambed, showing how the water chanel moves over time. |
||
|
aet_040.jpg | Hydrology Field Work 2019 | Hydrology | Watershed 6 gage house |
|
|
aet_050.jpg | Hydrology Field Work 2019 | Hydrology | the stream in Watershed 01 in the HJ Andrews Experimental Forest LTER site |
|
|
aet_051.jpg | Hydrology Field Work 2019 | hydrology well in Watershed 01 in the HJ Andrews Experimental Forest LTER site |
||
|
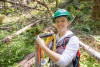
aet_047.jpg | Hydrology Field Work 2019 | Hydrology | Graduate student, Paige Becker, with a pressure transducer that measures the head gradient in the streambed. |
|
|
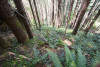
aet_053.jpg | Hydrology Field Work 2019 | Looking down the north slope, toward the streambed, in Watershed 01 |
||
|
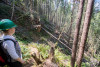
aet_054.jpg | Hydrology Field Work 2019 | Graduate student Paige Becker looks down the north slope of Watershed 01, where a heavy snow brought down many trees in late spring |
||
|
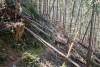
aet_055.jpg | Hydrology Field Work 2019 | looking down the north slope of Watershed 01, where a heavy snow brought down many trees in late spring |
||
|
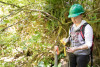
aet_049.jpg | Hydrology Field Work 2019 | Hydrology | Graduate student, Paige Becker, with a sampling device that measure electrical conductivity of the water |
|
|
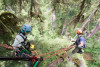
aeq_032.jpg | Dwarf Mistletoe Survey 2019 | Vegetation, Disturbance | Sky Lan (left) and Stephen Calkins (right) assess and record data on dwarf mistletoe in the canopy of a western hemlock tree |
|
|
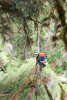
aeq_031.jpg | Dwarf Mistletoe Survey 2019 | Stephen Calkins inspects a "witches' broom," a branch infected by dwarf mistletoe. |
||
|
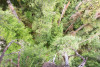
aeq_030.jpg | Dwarf Mistletoe Survey 2019 | Looking down into the upper and mid-canopy of the forest |
||
|
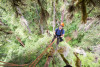
aeq_029.jpg | Dwarf Mistletoe Survey 2019 | Graduate student Stephen Calkins high in the canopy of a western hemlock tree |
||
|
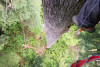
aeq_028.jpg | Dwarf Mistletoe Survey 2019 | Looking DOWN the tree trunk as we climbed. For scale, note the backpacks on the ground. |
||
|
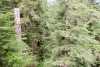
aeq_027.jpg | Dwarf Mistletoe Survey 2019 | Looking across at the mid-canopy layer in the forest: dead tree snags, douglas fir and western hemlock trees. |
||
|
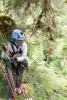
aeq_033.jpg | Dwarf Mistletoe Survey 2019 | Sky Lan in the high canopy of a western hemlock tree |
||
|
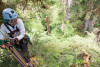
aeq_034.jpg | Dwarf Mistletoe Survey 2019 | Sky Lan in the high canopy of a western hemlock tree |
||
|
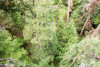
aeq_035.jpg | Dwarf Mistletoe Survey 2019 | Looking down into the upper and mid-canopy of the forest. We can see the lacy branching of western hemlock trees nearby |
||
|
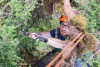
aeq_036.jpg | Dwarf Mistletoe Survey 2019 | Stephen Calkins measures the size of the mistletoe broom--the part of branch affected and deformed by dwarf mistletoe |
||
|
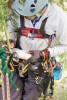
aeq_037.jpg | Dwarf Mistletoe Survey 2019 | Sky Lan records data about dwarf mistletoe |
||
|
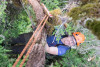
aeq_038.jpg | Dwarf Mistletoe Survey 2019 | Stephen Calkins measures the size of the mistletoe broom--the part of branch affected and deformed by dwarf mistletoe |
||
|
aeq_039.jpg | Dwarf Mistletoe Survey 2019 | Looking across into the canopy of the forest. In the top right of the photo, nearby, is a dwarf mistletoe broom. |
||
|
aeq_003.jpg | Dwarf Mistletoe Survey 2019 | Graduate student Stephen Calkins (left) and postdoc Sky Lan (right) prepare and check gear for climbing into the canopy |
||
|
aeq_026.jpg | Dwarf Mistletoe Survey 2019 | Sky Lan, ever cheerful, mid-climb into the canopy of a very tall western hemlock tree |
||
|
aeq_019.jpg | Dwarf Mistletoe Survey 2019 | Sky Lan prepares her gear for her climb into the canopy |
||
|
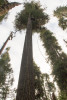
aeq_009.jpg | Dwarf Mistletoe Survey 2019 | Stephen Calkins ascends into the canopy of a western hemlock tree |
||
|
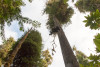
aeq_008.jpg | Dwarf Mistletoe Survey 2019 | Biological Diversity, Vegetation | Stephen Calkins ascends into the canopy of a western hemlock tree |
|
|
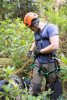
aeq_007.jpg | Dwarf Mistletoe Survey 2019 | Biological Diversity, Disturbance | Stephen Calkins prepares his climbing harness |
|
|
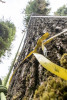
aeq_006.jpg | Dwarf Mistletoe Survey 2019 | Looking UP into the western hemlock tree that will be climbed as part of the dwarf mistletoe survey |
||
|
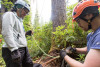
aeq_005.jpg | Dwarf Mistletoe Survey 2019 | Sky Lan (left) and Stephen Calkins (right) gear check before their climb into the canopy |
||
|
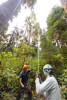
aeq_004.jpg | Dwarf Mistletoe Survey 2019 | Stephen Calkins (left) and Sky Lan (right) start to pull their rope into the tree. |
||
|
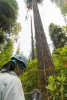
aeq_002.jpg | Dwarf Mistletoe Survey 2019 | Sky Lan and the large western hemlock tree which will be climbed for the dwarf mistletoe study |
||
|
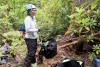
aeq_001.jpg | Dwarf Mistletoe Survey 2019 | Sky (Yung-Hsiang) Lan, a postdoc, readies ropes and gear for climbing the tree |
||
|
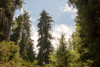
aeq_079.jpg | Dwarf Mistletoe Survey 2019 | The tree, in the center, is where Sky and Stephen were doing their work on this particular day and where the photos were taken |
||
|
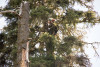
aeq_078.jpg | Dwarf Mistletoe Survey 2019 | Sky Lan and Stephen Calkins in the canopy. Photo taken from the ground with a zoom lens. |
||
|
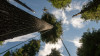
aeq_077.jpg | Dwarf Mistletoe Survey 2019 | Looking back up the tree, just after the climb |
||
|
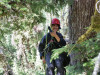
aeq_076.jpg | Dwarf Mistletoe Survey 2019 | Lina DiGregorio, ready to descend back to the ground after photographing Stephen's and Sky's field work in the canopy |
||
|
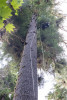
aeq_010.jpg | Dwarf Mistletoe Survey 2019 | Stephen Calkins ascends into the canopy of a western hemlock tree |
||
|
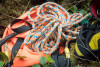
aeq_011.jpg | Dwarf Mistletoe Survey 2019 | Climbing rope |
||
|
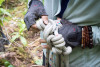
aeq_012.jpg | Dwarf Mistletoe Survey 2019 | Sky Lan ties and checks knots in her climbing rope |
||
|
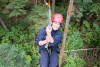
aeq_025.jpg | Dwarf Mistletoe Survey 2019 | Lina DiGregorio (the photographer for this series), amazed, and midway up the climb into the canopy |
||
|
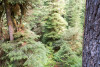
aeq_024.jpg | Dwarf Mistletoe Survey 2019 | Looking down into the understory, from midway up the trunk of the western hemlock |
||
|
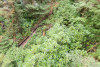
aeq_023.jpg | Dwarf Mistletoe Survey 2019 | Looking down into the understory, from midway up the trunk of the western hemlock |
||
|
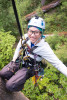
aeq_022.jpg | Dwarf Mistletoe Survey 2019 | Sky Lan climbing into the canopy to start her day of field work in the crown of a western hemlock tree |
||
|
aeq_021.jpg | Dwarf Mistletoe Survey 2019 | Sky Lan starts her climb |
||
|
aeq_020.jpg | Dwarf Mistletoe Survey 2019 | A close up of the climbing gear |
||
|
aeq_018.jpg | Dwarf Mistletoe Survey 2019 | To do field work in the canopy of the forest it takes time, planning, and a lot of climbing gear and rope. |
||
|
aeq_017.jpg | Dwarf Mistletoe Survey 2019 | Sky Lan prepares for her climb into the canopy |
||
|
aeq_016.jpg | Dwarf Mistletoe Survey 2019 | Carabiners and climbing gear |
||
|
aeq_015.jpg | Dwarf Mistletoe Survey 2019 | Because the distance makes it hard to hear, Sky and Stephen use radios to communicate between the tree crown and the ground. |
||
|
aeq_014.jpg | Dwarf Mistletoe Survey 2019 | Carabiners ("beeners" as Sky fondly called them) and a descender, used for working in the canopy |
||
|
aeq_013.jpg | Dwarf Mistletoe Survey 2019 | Sky Lan checks and readies her climbing rope |
||
|
aeq_075.jpg | Dwarf Mistletoe Survey 2019 | Stephen Calkins, Lina DiGregorio, Sky Lan |
||
|
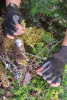
aeq_045.jpg | Dwarf Mistletoe Survey 2019 | Fruting bodies of western dwarf mistletoe |
||
|
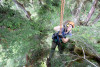
aeq_056.jpg | Dwarf Mistletoe Survey 2019 | Using a laser rangefinder to record distances and branch lengths |
||
|
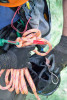
aeq_042.jpg | Dwarf Mistletoe Survey 2019 | A close up of Stephen's gear |
||
|
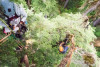
aeq_041.jpg | Dwarf Mistletoe Survey 2019 | Sky Lan (left) and Stephen Calkins (right) assess and record data on dwarf mistletoe in the canopy of a western hemlock tree |
||
|
aeq_040.jpg | Dwarf Mistletoe Survey 2019 | Looking down into the upper and mid-canopy of the forest. We can see the lacy branching of western hemlock trees nearby |
||
|
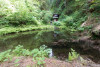
aet_039.jpg | Hydrology Field Work 2019 | The gage house and sediment basin in Watershed 02 |
||
|
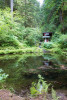
aet_038.jpg | Hydrology Field Work 2019 | The gage house and sediment basin in Watershed 02 |
||
|
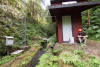
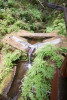
aet_035.jpg | Hydrology Field Work 2019 | Hydrology | Visiting researcher Nicolas Vergara, watershed technician, from the Universidad Austral de Chile, Valdivia, Chile, at the gage house of Watershed 02 |
|
|
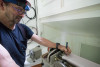
aet_034.jpg | Hydrology Field Work 2019 | Hydrology | The flume with low flow v-notch weir plate attached, in Watershed 02. The flume is used to measure the volume of water leaving the watershed. The flume, and streamflow record, started in 1952. Stream chemistry measurements began in 1981. |
|
|
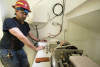
aet_033.jpg | Hydrology Field Work 2019 | Hydrology | USFS Hydrologic Technician Greg Downing annotates a continuous graphic record of stream stage fluctuations taken by a Stevens Type A-71 recorder |
|
|
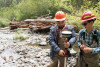
aet_032.jpg | Hydrology Field Work 2019 | Hydrology | USFS Hydrologic Technician Greg Downing, makes notations on the streamflow data collected by a Model 2, Stevens Water Monitoring Systems, Position Analog Transmitter (PAT) controlled by a Campbell Scientific CR-1000 data logger |
|
|
aet_004.jpg | Hydrology Field Work 2019 | (L to R) Alberto Paredes, visiting researcher from Universidad Austral de Chile, Valdivia, Chile, and Arianna Goodman, graduate student OSU, holding a Real Time Kinematic (RTK) GPS receiver to make precise measurements of positions in the stream. |
||
|
aet_005.jpg | Hydrology Field Work 2019 | (L to R) Alberto Paredes, visiting researcher from Universidad Austral de Chile, Valdivia, Chile, and Arianna Goodman, graduate student OSU, holding a Real Time Kinematic (RTK) GPS receiver to make precise measurements of positions in the stream |
||
|
aet_006.jpg | Hydrology Field Work 2019 | Hydrology | (L to R) Alberto Paredes, visiting researcher from Universidad Austral de Chile, and Arianna Goodman, grad student OSU, converse with USFS Hydrologic Technician Greg Downing on the location & history of stream cross-section locations in Lookout Creek |
|
|
aeq_046.jpg | Dwarf Mistletoe Survey 2019 | Stephen Calkins holds fruiting bodies of the dwarf mistletoe plant: the female plant is on the left, the male on the right |
||
|
aeq_047.jpg | Dwarf Mistletoe Survey 2019 | Sky Lan (left) and Stephen Calkins (right) keep a positive work atmosphere |
||
|
aeq_048.jpg | Dwarf Mistletoe Survey 2019 | Sky Lan records data about dwarf mistletoe |
||
|
aeq_049.jpg | Dwarf Mistletoe Survey 2019 | Sky Lan (left) and Stephen Calkins (right) assess and record data on dwarf mistletoe in the canopy of a western hemlock tree |
||
|
aeq_050.jpg | Dwarf Mistletoe Survey 2019 | Looking down through the canopy of the forest |
||
|
aeq_057.jpg | Dwarf Mistletoe Survey 2019 | Looking across at the mid-canopy layer in the forest: dead tree snags, douglas fir and western hemlock trees. |
||
|
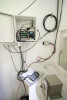
aet_037.jpg | Hydrology Field Work 2019 | Hydrology | Instrumentation in Watershed 2: The Campbell Scientific CR-1000 data logger: CR10X data loggers were installed in 1999. The Cr-10x's data loggers were replaced with CR-1000's in 2015. |
|
|
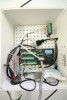
aet_036.jpg | Hydrology Field Work 2019 | Hydrology | Instrumentation in Watershed 2: Campbell Scientific CR-1000 data logger collects data on stream stage (water depth) in the flume, air and water temperature, and water conductivity. It triggers the automated Hach/Sigma water sampler based on stage height. |
|
|
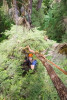
aeq_043.jpg | Dwarf Mistletoe Survey 2019 | Stephen Calkins high in the canopy of a western hemlock tree, where he studies the affects of dwarf mistletoe |
||
|
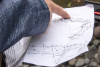
aet_007.jpg | Hydrology Field Work 2019 | Hydrology | 1990 map of the stream channel in lower Lookout Creek by Nakamura and Swanson used as a reference in the 2019 survey. Map depicts channel morphology and the location of sample cross sections. |
|
|
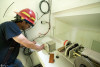
aet_031.jpg | Hydrology Field Work 2019 | Hydrology | USFS Hydrologic Technician Greg Downing, makes notations on the streamflow data collected by a Model 2, Stevens Water Monitoring Systems, Position Analog Transmitter (PAT) controlled by a Campbell Scientific CR-1000 data logger. |
|
|
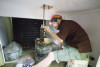
aet_030.jpg | Hydrology Field Work 2019 | Hydrology | Visiting researcher Nicolas Vergara reads the hook gauge to determine stream stage (water depth) in the flume |
|
|
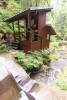
aet_029.jpg | Hydrology Field Work 2019 | Hydrology | Nicolas Vergara, watershed technician, Universidad Austral de Chile, Valdivia, Chile, and Greg Downing, USFS Hydrologic Technician, at the gage house and flume in Watershed 02 |
|
|
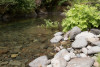
aet_015.jpg | Hydrology Field Work 2019 | Lower Lookout Creek, near headquarters |
||
|
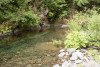
aet_013.jpg | Hydrology Field Work 2019 | Lower Lookout Creek, near headquarters |
||
|
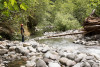
aet_012.jpg | Hydrology Field Work 2019 | Lower Lookout Creek, near headquarters |
||
|
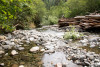
aet_011.jpg | Hydrology Field Work 2019 | Hydrology | USFS Hydrologic Technician Greg Downing, at Lower Lookout Creek, near headquarters |
|
|
aet_010.jpg | Hydrology Field Work 2019 | Lower Lookout Creek, near headquarters |
||
|
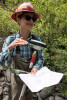
aet_009.jpg | Hydrology Field Work 2019 | OSU graduate student Arianna Goodman holds a 1990 map of the stream chanel and cross section locations in lower Lookout Creek. |
||
|
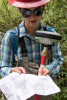
aet_008.jpg | Hydrology Field Work 2019 | OSU graduate student Arianna Goodman holds a 1990 map of the stream chanel and cross section locations in lower Lookout Creek. |
||
|
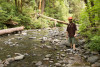
aet_003.jpg | Hydrology Field Work 2019 | Nicolas Vergara, watershed technician, visiting from Universidad Austral de Chile, Valdivia, Chile, in Lookout Creek, near headquarters |
||
|
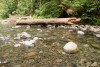
aet_002.jpg | Hydrology Field Work 2019 | Lower Lookout Creek, near headquarters |
||
|
aet_001.jpg | Hydrology Field Work 2019 | Lower Lookout Creek, near headquarters |
||
|
aet_016.jpg | Hydrology Field Work 2019 | Hydrology | The stream gage house and flume with low flow v-notch weir plate attached. |
|
|
aet_017.jpg | Hydrology Field Work 2019 | Hydrology | The stream gage house and flume with low flow v-notch weir plate attached. |
|
|
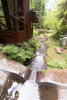
aet_018.jpg | Hydrology Field Work 2019 | Hydrology | Nicolas Vergara, watershed technician, Universidad Austral de Chile, Valdivia, Chile, and Greg Downing, USFS Hydrologic Technician, at the gage house and flume in Watershed 02 |
|
|
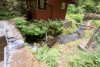
aet_028.jpg | Hydrology Field Work 2019 | Hydrology | The WS02 stream gage house and flume with low flow v-notch weir plate attached. |
|
|
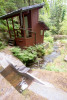
aet_027.jpg | Hydrology Field Work 2019 | Hydrology | The WS02 stream gage house and flume with low flow v-notch weir plate attached. |
|
|
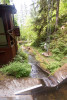
aet_026.jpg | Hydrology Field Work 2019 | Hydrology | The WS02 stream gage house and flume with low flow v-notch weir plate attached. |
|
|
aet_025.jpg | Hydrology Field Work 2019 | Hydrology | The WS02 stream gage house and flume with low flow v-notch weir plate attached. |
|
|
aet_024.jpg | Hydrology Field Work 2019 | Hydrology | Greg Downing, USFS Hydrologic Technician, maintains the automated water sampler in the Watershed 02 gage house |
|
|
aet_023.jpg | Hydrology Field Work 2019 | Hydrology | USFS Hydrologic Technician Greg Downing, and visiting researcher Nicolas Vergara, prepare a water chemistry sample from Watershed 02 |