
Image Search
| Thumbnail | Media name | Gallery | Keyword Tags | Caption | Photographed date Sort ascending |
|---|---|---|---|---|---|
|
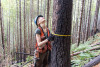
afa_015.jpg | Vegetation survey after wildfire 2021 | Field technician Lillian Evergreen measures the diameter of a burned and still live tree in the plot |
||
|
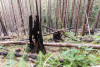
afa_016.jpg | Vegetation survey after wildfire 2021 | burned and recovering hillside of WS1 |
||
|
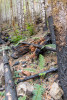
afa_017.jpg | Vegetation survey after wildfire 2021 | burned and recovering hillside of WS1 |
||
|
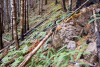
afa_018.jpg | Vegetation survey after wildfire 2021 | burned and recovering hillside of WS1 |
||
|
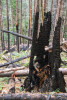
afa_019.jpg | Vegetation survey after wildfire 2021 | burned and recovering hillside of WS1 |
||
|
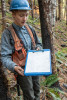
afa_020.jpg | Vegetation survey after wildfire 2021 | Field technician Lauren Dorsch shows the data sheet used by the vegetation crew |
||
|
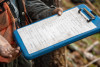
afa_021.jpg | Vegetation survey after wildfire 2021 | Data sheet used by the vegetation crew |
||
|
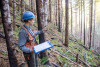
afa_022.jpg | Vegetation survey after wildfire 2021 | Field technician Lauren Dorsch shows the data sheet used by the vegetation crew |
||
|
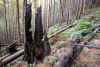
afa_023.jpg | Vegetation survey after wildfire 2021 | burned and recovering hillside of WS1 |
||
|
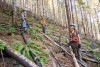
afa_024.jpg | Vegetation survey after wildfire 2021 | The vegetation field crew traverses the steep slope of Watershed 1 |
||
|
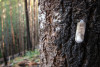
afa_025.jpg | Vegetation survey after wildfire 2021 | Tagged tree in area of WS1 burned by the Holiday Farm fire |
||
|
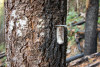
afa_026.jpg | Vegetation survey after wildfire 2021 | Tagged tree in area of WS1 burned by the Holiday Farm fire |
||
|
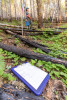
afa_027.jpg | Vegetation survey after wildfire 2021 | Data sheet used by the vegetation crew |
||
|
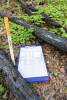
afa_028.jpg | Vegetation survey after wildfire 2021 | Data sheet and plot marker in permanent vegetation plot of WS1 |
||
|
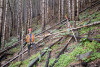
afa_029.jpg | Vegetation survey after wildfire 2021 | Field technician Jonathan Cowan in Watershed 1 after the Holiday Farm fire |
||
|
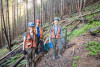
afa_030.jpg | Vegetation survey after wildfire 2021 | The vegetation field crew on the steep, burned slope of Watershed 1 |
||
|
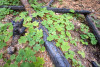
afa_031.jpg | Vegetation survey after wildfire 2021 | burned and recovering hillside of WS1 |
||
|
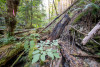
afa_032.jpg | Vegetation survey after wildfire 2021 | Streambed in WS1 |
||
|
afa_033.jpg | Vegetation survey after wildfire 2021 | Field technician Lauren Dorsch in Watershed 1 |
||
|
afa_034.jpg | Vegetation survey after wildfire 2021 | Field technician Lauren Dorsch in Watershed 1 |
||
|
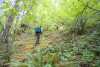
afa_035.jpg | Vegetation survey after wildfire 2021 | Field crew in an unburned vegetation plot in WS1 |
||
|
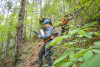
afa_036.jpg | Vegetation survey after wildfire 2021 | Field crew remeasures vegetation in a permanent study plot |
||
|
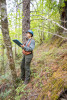
afa_037.jpg | Vegetation survey after wildfire 2021 | Field crew remeasures vegetation in a permanent study plot |
||
|
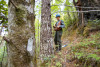
afa_038.jpg | Vegetation survey after wildfire 2021 | Field crew remeasures vegetation in a permanent study plot |
||
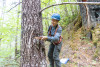
|
afa_039.jpg | Vegetation survey after wildfire 2021 | Field technician Lauren Dorsch measures tree diameter |
||
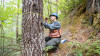
|
afa_040.jpg | Vegetation survey after wildfire 2021 | Field technician Lauren Dorsch measures tree diameter |
||
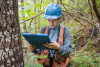
|
afa_041.jpg | Vegetation survey after wildfire 2021 | Vegetation, Disturbance | Field crew remeasures vegetation in a permanent study plot |
|
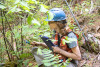
|
afa_042.jpg | Vegetation survey after wildfire 2021 | Field technician Lillian Evergreen uses a caliper to measure stem diameter |
||
|
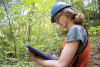
afa_043.jpg | Vegetation survey after wildfire 2021 | Field technician Lillian Evergreen records data on vegetation |
||
|
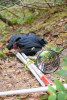
afa_044.jpg | Vegetation survey after wildfire 2021 | Field equipment |
||
|
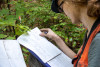
afa_045.jpg | Vegetation survey after wildfire 2021 | Field technician Lillian Evergreen records data on vegetation |
||
|
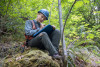
afa_046.jpg | Vegetation survey after wildfire 2021 | Field technician Lauren Dorsch records data on vegetation |
||
|
afa_047.jpg | Vegetation survey after wildfire 2021 | Field crew takes note of species type and vigor of plants in the study plots |
||
|
afa_048.jpg | Vegetation survey after wildfire 2021 | Field crew takes note of species type and vigor of plants in the study plots |
||
|
afa_049.jpg | Vegetation survey after wildfire 2021 | Field technician Lillian Evergreen records data on vegetation |
||
|
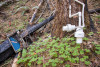
afa_050.jpg | Vegetation survey after wildfire 2021 | Field equipment that measures temperature and air movement |
||
|
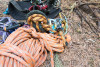
aez_001.jpg | Canopy Ecology Field Work 2021 | Climbing rope, harnesses, lanyard, ascenders and carabiners are tools of the trade for a canopy ecologist whose field work is up in the trees |
||
|
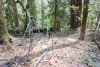
aez_002.jpg | Canopy Ecology Field Work 2021 | Instruments measure air temperature, air humidity, and air movement. The measurements on the ground are compared to measurements taken in the tree canopy. |
||
|
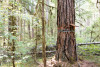
aez_003.jpg | Canopy Ecology Field Work 2021 | A dendrometer band around a large Douglas-fir tree measures the daily and annual swell and contraction of the tree trunk. |
||
|
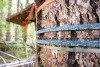
aez_004.jpg | Canopy Ecology Field Work 2021 | A dendrometer band around a large Douglas-fir tree measures the daily and annual swell and contraction of the tree trunk. |
||
|
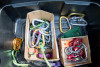
aez_005.jpg | Canopy Ecology Field Work 2021 | Tree climbers use carabiners to climb and to attach their gear to their harnesses |
||
|
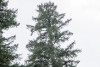
aez_006.jpg | Canopy Ecology Field Work 2021 | Adam Sibley 56 meters above ground in the Discovery Tree. The white enclosure above his head contains the data logger that records and transmits data from sensors in the upper canopy. |
||
|
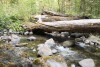
aez_007.jpg | Canopy Ecology Field Work 2021 | Lookout Creek along the Discovery Trail |
||
|
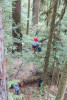
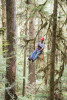
aez_008.jpg | Canopy Ecology Field Work 2021 | Mark Schulze, Andrews Forest Director, begins his ascent into the canopy to take measurements |
||
|
aez_009.jpg | Canopy Ecology Field Work 2021 | Mark Schulze, Andrews Forest Director, takes a few minutes in the mid canopy as he makes his way high into the tree tops to make measurements |
||
|
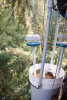
aez_010.jpg | Canopy Ecology Field Work 2021 | The blue and white discs in this image contain spore collectors for measuring the diversity of fungal spores which make it to this height in the canopy. This setup is replicated at six canopy heights. |
||
|
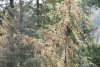
aez_011.jpg | Canopy Ecology Field Work 2021 | The orange needles on this western hemlock branch are scorched, caused by a heat dome in summer 2021 that brought maximum air temperatures above 110 o F for three consecutive days. |
||
|
aez_012.jpg | Canopy Ecology Field Work 2021 | The orange needles on this western hemlock branch are scorched, caused by a heat dome in summer 2021 that brought maximum air temperatures above 110 o F for three consecutive days. |
||
|
aez_013.jpg | Canopy Ecology Field Work 2021 | Canopy Ecology | Mark Schulze clips samples of branches high in the canopy as part of a study on needle scorch caused by the heat dome of summer 2021 |
|
|
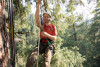
aez_014.jpg | Canopy Ecology Field Work 2021 | Adam Sibley, graduate student, at ease high in the canopy. Adam spend many days and hours in the canopy for his research on assessing tree canopy microclimate and the response of trees to environmental stress |
||
|
aez_015.jpg | Canopy Ecology Field Work 2021 | Looking down from high in the canopy into the crowns of neighboring trees |
||
|
aez_016.jpg | Canopy Ecology Field Work 2021 | Looking down from high in the canopy into the crowns of neighboring trees |
||
|
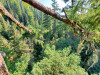
aez_017.jpg | Canopy Ecology Field Work 2021 | Looking down from high in the canopy into the crowns of neighboring trees |
||
|
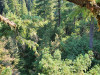
aez_018.jpg | Canopy Ecology Field Work 2021 | Looking down from high in the canopy into the crowns of neighboring trees |
||
|
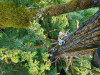
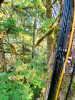
aez_019.jpg | Canopy Ecology Field Work 2021 | The cables and instruments along the tree trunk measure microclimate from the bottom of the tree to the top. Researchers measure temperature, humidity, leaf wetness and wind speed and direction. Suspended buckets measure fungal spore diversity. |
||
|
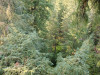
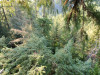
aez_020.jpg | Canopy Ecology Field Work 2021 | Looking down from high in the canopy into the crowns of neighboring trees |
||
|
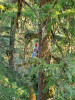
aez_021.jpg | Canopy Ecology Field Work 2021 | Looking down from high in the canopy into the crowns of neighboring trees |
||
|
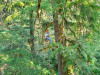
aez_022.jpg | Canopy Ecology Field Work 2021 | Mark Schulze, Andrews Forest Director, takes a few minutes in the mid canopy as he makes his way high into the tree tops to make measurements |
||
|
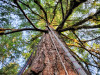
aez_023.jpg | Canopy Ecology Field Work 2021 | Mark Schulze climbing a neighbor of the Discovery Tree |
||
|
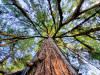
aez_024.jpg | Canopy Ecology Field Work 2021 | The cables and instruments along the tree trunk measure microclimate from the bottom of the tree to the top. Researchers measure temperature, humidity, leaf wetness and wind speed and direction. |
||
|
aez_025.jpg | Canopy Ecology Field Work 2021 | The cables and instruments along the tree trunk measure microclimate from the bottom of the tree to the top. Researchers measure temperature, humidity, leaf wetness and wind speed and direction. |
||
|
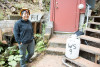
aez_026.jpg | Canopy Ecology Field Work 2021 | The cables and instruments along the tree trunk measure microclimate from the bottom of the tree to the top. Researchers measure temperature, humidity, leaf wetness and wind speed and direction. |
||
|
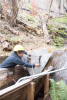
aey_001.jpg | Hydrology and Hyporheic Studies 2021 | USFS Intern Araceli Morales-Santos at gage house of Watershed 9 (WS09) in the HJ Andrews Experimental Forest |
||
|
aey_002.jpg | Hydrology and Hyporheic Studies 2021 | USFS Intern Araceli Morales-Santos puts leaf guard on v-notch weir at WS09 stream gage |
||
|
aey_003.jpg | Hydrology and Hyporheic Studies 2021 | USFS Intern Araceli Morales-Santos puts leaf guard on v-notch weir at WS09 stream gage |
||
|
aey_004.jpg | Hydrology and Hyporheic Studies 2021 | USFS Intern Araceli Morales-Santos measures water stage at the v-notch weir at WS09 stream gage |
||
|
aey_005.jpg | Hydrology and Hyporheic Studies 2021 | USFS Intern Araceli Morales-Santos at the v-notch weir at WS09 stream gage |
||
|
aey_006.jpg | Hydrology and Hyporheic Studies 2021 | USFS Intern Araceli Morales-Santos measures water stage at the v-notch weir at WS09 stream gage |
||
|
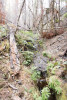
aey_007.jpg | Hydrology and Hyporheic Studies 2021 | Stream channel of WS09 just above the stream gage, a year after the 2020 Holiday Farm Fire |
||
|
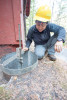
aey_008.jpg | Hydrology and Hyporheic Studies 2021 | USFS Intern Araceli Morales-Santos at the stilling well at WS09 stream gage |
||
|
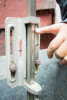
aey_009.jpg | Hydrology and Hyporheic Studies 2021 | Ruler for manual checks of stage height in stilling well at a stream gage |
||
|
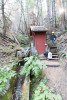
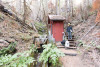
aey_010.jpg | Hydrology and Hyporheic Studies 2021 | USFS Intern Araceli Morales-Santos at WS09 gage house one year after 2020 fire in the HJ Andrews Experimental Forest |
||
|
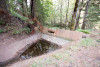
aey_011.jpg | Hydrology and Hyporheic Studies 2021 | USFS Intern Araceli Morales-Santos at WS09 gage house one year after 2020 fire in the HJ Andrews Experimental Forest |
||
|
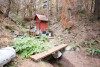
aey_012.jpg | Hydrology and Hyporheic Studies 2021 | The sediment basin dam at WS09 was rebuilt after it burned in the 2020 Holiday Farm fire |
||
|
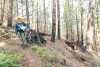
aey_013.jpg | Hydrology and Hyporheic Studies 2021 | USFS Intern Araceli Morales-Santos at WS09 gage house one year after 2020 fire in the HJ Andrews Experimental Forest |
||
|
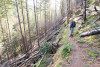
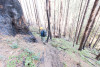
aey_014.jpg | Hydrology and Hyporheic Studies 2021 | Oregon State University graduate student, Paige Becker, walks to her field study site in Watershed 01, a year after the 2020 Holiday Farm fire burned through |
||
|
aey_015.jpg | Hydrology and Hyporheic Studies 2021 | Oregon State University graduate student, Paige Becker, walks to her field study site in Watershed 01, a year after the 2020 Holiday Farm fire burned through |
||
|
aey_016.jpg | Hydrology and Hyporheic Studies 2021 | Oregon State University graduate student, Paige Becker, walks to her field study site in Watershed 01, a year after the 2020 Holiday Farm fire burned through |
||
|
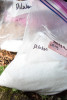
aey_017.jpg | Hydrology and Hyporheic Studies 2021 | Salt measured out for a tracer study in the stream in Watershed 01. The salt tracer is used to measure how long it takes for water to move down the stream bed |
||
|
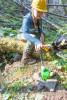
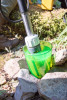
aey_018.jpg | Hydrology and Hyporheic Studies 2021 | Oregon State University graduate student, Paige Becker, preparing a fluorescent tracer (also known as uranine) used to measure flow rates in streams. |
||
|
aey_019.jpg | Hydrology and Hyporheic Studies 2021 | A fluorescent tracer (uranine) used to measure flow rates in streams. |
||
|
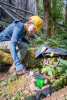
aey_020.jpg | Hydrology and Hyporheic Studies 2021 | Oregon State University graduate student, Paige Becker, preparing a fluorescent tracer used to measure flow rates in streams. |
||
|
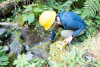
aey_021.jpg | Hydrology and Hyporheic Studies 2021 | Oregon State University graduate student, Paige Becker, using a meter to quantify concentrations of tracers in the stream |
||
|
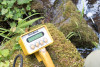
aey_022.jpg | Hydrology and Hyporheic Studies 2021 | A sensor for measuring concentration of fluorescent tracers in stream water. |
||
|
aey_023.jpg | Hydrology and Hyporheic Studies 2021 | Oregon State University graduate student, Paige Becker, using a sensor to quantify concentrations of tracers in the stream |
||
|
aey_024.jpg | Hydrology and Hyporheic Studies 2021 | Oregon State University graduate student, Paige Becker, using a sensor to quantify concentrations of tracers in the stream |
||
|
aey_025.jpg | Hydrology and Hyporheic Studies 2021 | Oregon State University graduate student, Paige Becker, working in the stream in Watershed 01 |
||
|
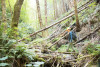
aey_026.jpg | Hydrology and Hyporheic Studies 2021 | A sensor for measuring water constituents in the stream. |
||
|
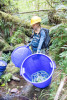
aey_027.jpg | Hydrology and Hyporheic Studies 2021 | Oregon State University graduate student, Paige Becker, near the stream in Watershed 01 |
||
|
aey_028.jpg | Hydrology and Hyporheic Studies 2021 | Paige Becker with tubing used in her tracer experiments |
||

|
aey_029.jpg | Hydrology and Hyporheic Studies 2021 | Tubing and fluorescent tracer used in tracer studies of residence time of water in streams |
||
|
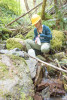
aey_030.jpg | Hydrology and Hyporheic Studies 2021 | Oregon State University graduate student, Paige Becker, preparing a salt tracer experiment in the stream in Watershed 01 |
||
|
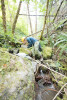
aey_031.jpg | Hydrology and Hyporheic Studies 2021 | Oregon State University graduate student, Paige Becker, conducting experiments in Watershed 01 |
||
|
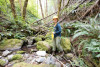
aey_032.jpg | Hydrology and Hyporheic Studies 2021 | Oregon State University graduate student, Paige Becker, conducting experiments in Watershed 01 |
||
|
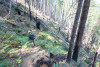
aey_033.jpg | Hydrology and Hyporheic Studies 2021 | Oregon State University graduate student, Paige Becker, walks to her field study site in Watershed 01, a year after the 2020 Holiday Farm fire burned through |
||
|
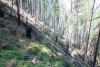
aey_034.jpg | Hydrology and Hyporheic Studies 2021 | Oregon State University graduate student, Paige Becker, walks to her field study site in Watershed 01, a year after the 2020 Holiday Farm fire burned through |
||
|
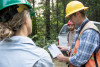
afd_001.jpg | Research Experience for Teachers (RET) 2021 | Vegetation Crew lead, Andy Bluhm (right) shows the digital data interface to RET Whitney Davis |
||
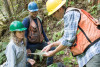
|
afd_002.jpg | Research Experience for Teachers (RET) 2021 | Andy Bluhm (right) shows the plot map to RETs Whitney Davis (left) and James Stoe (right) |
||
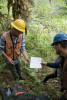
|
afd_003.jpg | Research Experience for Teachers (RET) 2021 | Andy Bluhm (left) and RET James Stoe (right) review the plot and stem map |
||
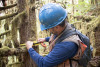
|
afd_004.jpg | Research Experience for Teachers (RET) 2021 | RET James Stoe measures diameter of a tree |
||
|
afd_005.jpg | Research Experience for Teachers (RET) 2021 | RET Whitney Davis assesses the health of a tree as part of the long-term vegetation study |
||
|
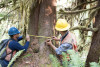
afd_006.jpg | Research Experience for Teachers (RET) 2021 | RET James Stoe (left) and field technician Andy Bluhm (right) measure the diameter of a tree that is part of a long-term study |
||
|
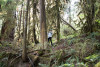
afd_007.jpg | Research Experience for Teachers (RET) 2021 | RET Whitney Davis measures the diameter of a tree |
||
|
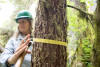
afd_008.jpg | Research Experience for Teachers (RET) 2021 | RET Whitney Davis measures the diameter of a tree |
||
|
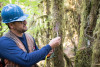
afd_009.jpg | Research Experience for Teachers (RET) 2021 | RET James Stoe reads of the tag number to a person nearby who is recording data |
||
|
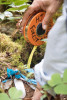
afd_010.jpg | Research Experience for Teachers (RET) 2021 | Tags and a measuring tape |
||
|
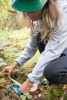
afd_011.jpg | Research Experience for Teachers (RET) 2021 | RET Whitney Davis measures the diameter of a tree trunk growing along the ground |
||
|
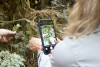
afd_012.jpg | Research Experience for Teachers (RET) 2021 | learning tree identification by needles |
||
|
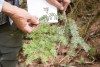
afd_013.jpg | Research Experience for Teachers (RET) 2021 | learning tree identification by needles |
||
|
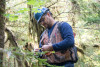
afd_014.jpg | Research Experience for Teachers (RET) 2021 | RET James Stoe measures diameter of a tree |
||
|
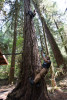
afd_015.jpg | Research Experience for Teachers (RET) 2021 | Research Experience for Teachers (RET) Whitney Davis (top) and James Stoe (bottom) begin their ascent up a Douglas fir tree to take measurements in the canopy |
||
|
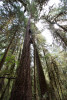
afd_016.jpg | Research Experience for Teachers (RET) 2021 | Research Experience for Teachers (RET) Whitney Davis (top) and James Stoe (bottom) ascend a Douglas fir tree to take measurements in the canopy |
||
|
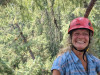
afd_017.jpg | Research Experience for Teachers (RET) 2021 | Vegetation | RET Whitney Davis climbs to the top of the canopy to take measurements as part of her Research Experience for Teachers program at the Andrews Forest |
|
|
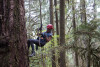
afd_018.jpg | Research Experience for Teachers (RET) 2021 | Vegetation | RET Whitney Davis climbs to the top of the canopy to take measurements as part of her Research Experience for Teachers program at the Andrews Forest |
|
|
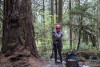
afd_019.jpg | Research Experience for Teachers (RET) 2021 | RET Whitney Davis climbed a Douglas Fir tree to take measurements as part of her Research Experience for Teachers program at the Andrews Forest |
||
|
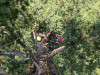
afd_020.jpg | Research Experience for Teachers (RET) 2021 | RET Whitney Davis climbed a Douglas Fir tree to take measurements as part of her Research Experience for Teachers program at the Andrews Forest |
||
|
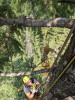
afd_021.jpg | Research Experience for Teachers (RET) 2021 | Research Experience for Teachers (RET) Whitney Davis and James Stoe begin their ascent up a Douglas fir tree to take measurements in the canopy |
||
|
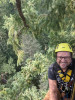
afd_022.jpg | Research Experience for Teachers (RET) 2021 | RET James Stoe climbed a Douglas Fir tree to take measurements as part of her Research Experience for Teachers program at the Andrews Forest |
||
|
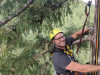
afd_023.jpg | Research Experience for Teachers (RET) 2021 | RET James Stoe climbed a Douglas Fir tree to take measurements as part of her Research Experience for Teachers program at the Andrews Forest |
||
|
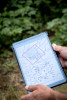
afd_024.jpg | Research Experience for Teachers (RET) 2021 | RET James Stoe climbed a Douglas Fir tree to take measurements as part of her Research Experience for Teachers program at the Andrews Forest |
||
|
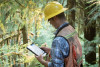
afe_001.jpg | Pacific Northwest Permanent Sample Plot Program, Field work 2021 | A tablet displays the study plot with the stem map of all the tagged trees in Reference Stand 38, a site within a regional long-term study on vegetation |
||
|
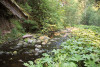
afe_002.jpg | Pacific Northwest Permanent Sample Plot Program, Field work 2021 | Field crew leader Andy Bluhm reviews the study plot map |
||
|
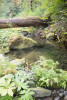
afe_003.jpg | Pacific Northwest Permanent Sample Plot Program, Field work 2021 | Lookout Creek |
||
|
afe_004.jpg | Pacific Northwest Permanent Sample Plot Program, Field work 2021 | Lookout Creek |
||
|
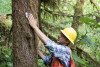
afe_005.jpg | Pacific Northwest Permanent Sample Plot Program, Field work 2021 | Field technician Sean Marcum records data on tree size and tree health |
||
|
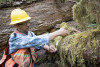
afe_006.jpg | Pacific Northwest Permanent Sample Plot Program, Field work 2021 | Andy Bluhm locates a tagged tree, part of a long-term study on vegetation |
||
|
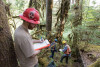
afe_007.jpg | Pacific Northwest Permanent Sample Plot Program, Field work 2021 | Andy Bluhm measures the diameter of a pacific yew tree that has a trunk growing parallel to the ground |
||
|
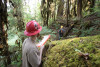
afe_008.jpg | Pacific Northwest Permanent Sample Plot Program, Field work 2021 | Field technician Sean Marcum records data on tree size and tree health as crew members measure and call out their data for recording |
||
|
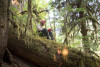
afe_009.jpg | Pacific Northwest Permanent Sample Plot Program, Field work 2021 | Moving through the research plots can be a challenge due to large logs and steep slopes |
||
|
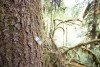
afe_010.jpg | Pacific Northwest Permanent Sample Plot Program, Field work 2021 | A tagged tree in the long-term vegetation permanent study plot study |
||
|
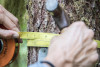
afe_011.jpg | Pacific Northwest Permanent Sample Plot Program, Field work 2021 | Field technician Sean Marcum records data on tree size and tree health |
||
|
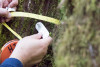
afe_012.jpg | Pacific Northwest Permanent Sample Plot Program, Field work 2021 | Taking the diameter of a tagged tree, just above the nail. This tree is about 17cm diameter. |
||
|
afe_013.jpg | Pacific Northwest Permanent Sample Plot Program, Field work 2021 | Recording the tag number and diameter of a tree in the long-term vegetation study |
||
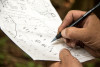
|
afe_014.jpg | Pacific Northwest Permanent Sample Plot Program, Field work 2021 | Researchers find and measure every tree in the study plot and mark each one off as they go. All tagged trees are tracked from year to year, over decades. |
||
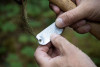
|
afe_015.jpg | Pacific Northwest Permanent Sample Plot Program, Field work 2021 | Sometimes a tag comes off a tree and needs to be replaced |
||
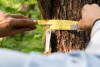
|
afe_016.jpg | Pacific Northwest Permanent Sample Plot Program, Field work 2021 | Recording the tag number and diameter of a tree in the long-term vegetation study |
||
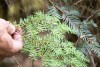
|
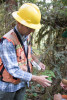
afe_017.jpg | Pacific Northwest Permanent Sample Plot Program, Field work 2021 | Vegetation | Comparing leaves of western hemlock (left) and Pacific yew (right) |
|
|
afe_018.jpg | Pacific Northwest Permanent Sample Plot Program, Field work 2021 | Comparing leaves of western hemlock (left) and Pacific yew (right) |
||
|
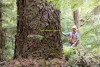
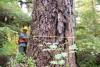
afe_019.jpg | Pacific Northwest Permanent Sample Plot Program, Field work 2021 | Andy Bluhm measures the diameter of a large Douglas fir tree in the HJ Andrews Experimental Forest |
||
|
afe_020.jpg | Pacific Northwest Permanent Sample Plot Program, Field work 2021 | Andy Bluhm measures the diameter of a large Douglas fir tree in the HJ Andrews Experimental Forest |
||
|
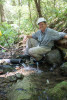
aew_033.jpg | Drought Experiment 2021 | Stream Ecology | Melissa Mauk, Keeley MacNeill, Allison Swartz, Dana Warren, Catalina Segura |
|
|
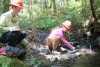
aew_034.jpg | Drought Experiment 2021 | Dana Warren takes a break from installing and inspecting tubing in the streambed |
||
|
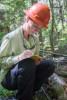
aew_036.jpg | Drought Experiment 2021 | Keeley MacNeill and Allison Swartz measure temperature at the outflow of the tubes that were heating in the sun |
||
|
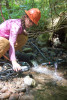
aew_037.jpg | Drought Experiment 2021 | Keeley MacNeill records water temperature |
||
|
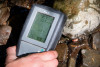
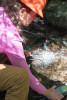
aew_038.jpg | Drought Experiment 2021 | Allison Swartz measures stream temperature from coils of tubing for the warming experiment |
||
|
aew_039.jpg | Drought Experiment 2021 | Stream temperature and specific conductivity meter used to measure warming from coils of tubing for the warming experiment and travel time through the tubing |
||
|
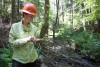
aew_040.jpg | Drought Experiment 2021 | Allison Swartz measures stream temperature from coils of tubing for the warming experiment |
||
|
aew_041.jpg | Drought Experiment 2021 | Keeley MacNeill recording stream temperature data |
||
|
aew_048.jpg | Drought Experiment 2021 | At McRae Tributary East, Dana Warren and crew inspect a riparian area where trees were removed in 2017 to increase the amount of sunlight to the streambed |
||
|
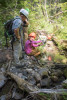
aew_049.jpg | Drought Experiment 2021 | Inspecting filamentous algae on the stream bed that only grows in high light conditions |