
Several options of maps, geospatial data, aerial imagery, and LIDAR maps are available to visitors and researchers.
If you're looking for driving directions, please see our Location and Directions page.

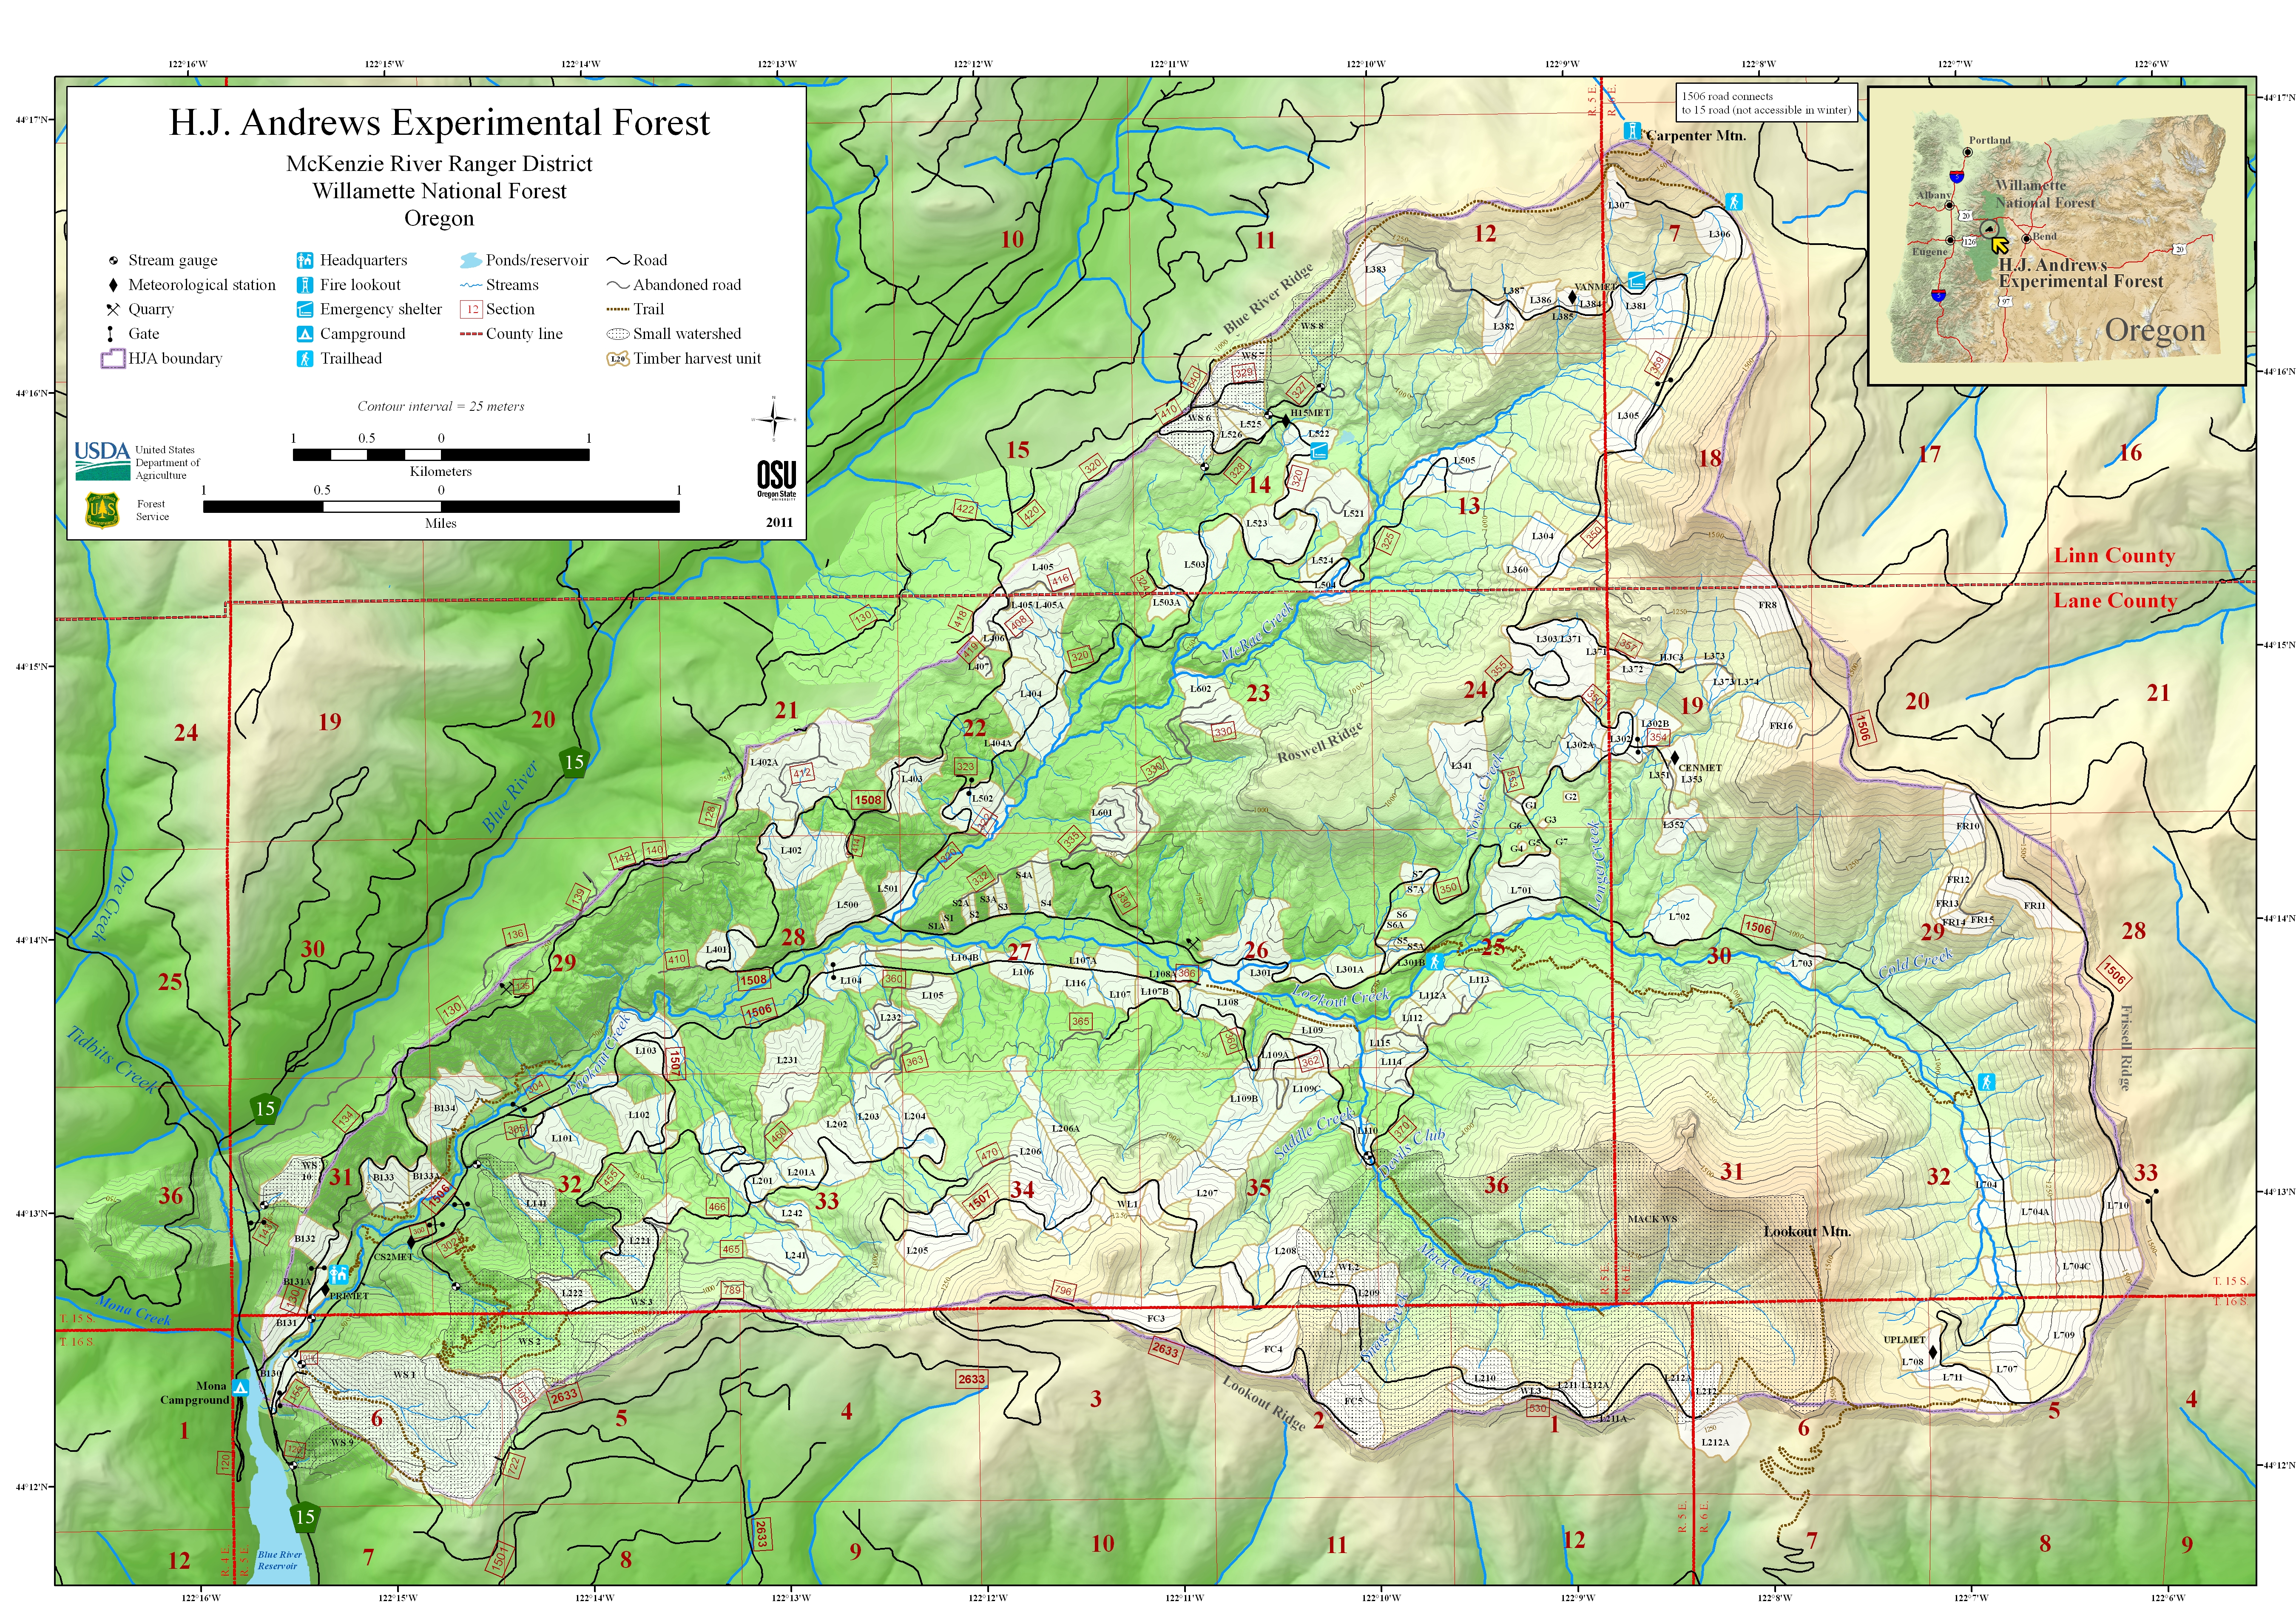
Map of the H.J. Andrews Experimental Forest
Geo-enabled PDF (18MB file). To use geo-enabled features, use a geopdf application (such as PDF Maps or Avenza Maps) on a GPS-enabled mobile device.
Basic map JPG (15MB file). This is the same map image as the geo-enabled PDF, but as a basic jpg file.
Maps and Spatial Data for Recent Fires
Recent fires in and around the H. J. Andrews Experimental forest include the Holiday Farm fire (2020), the Lookout fire (2023), and the Ore fire (2024). Spatial data, including shapefiles for burn perimeters and gridded satellite imagery used to generate vegetation burn severity products are also available below. Map products for 2020 and 2023 were generated by the Monitoring Trends in Burn Severity (MTBS) program (https://www.mtbs.gov/). Map products for 2024 will be posted when they are made available by MTBS. The citation for these data is: MTBS Data Access: Fire Level Geospatial Data. MTBS Project (USDA Forest Service/U.S. Geological Survey). Available online: https://burnseverity.cr.usgs.gov/viewer/?product=MTBS [June 6, 2025].
Holiday Farm Fire (2020)
- Holiday Farm Fire Map, with acreage of burn severity (.pdf)
- Fire severity geographic data (.kmz shape file)
- GIS Directory (.zip file 42MB)
Lookout Fire (2023)
- Lookout Fire Map, with acreage of burn severity (.pdf)
- Fire severity geographic data (.kmz shape file)
- GIS Directory (.zip file 8MB)

LIDAR Data and Imagery
LIDAR (Light detection and ranging) acquired through aerial surveys provides high-resolution, active remote sensing of the elevation of the ground surface and height of vegetation. Lidar acquisitions covering all or part of the Lookout Creek watershed were conducted in 2008, 2011, 2014, 2016, 2020, 2021, 2023, and 2024. Access to the raw data (very large files) can be arranged by contacting the Information Managers. Derivative products will be published at the USDA Forest Service Research Data Archive (review currently in process) and include:
- Digital surface models, canopy surface models, and canopy height models (1-m)
- Slope, aspect, and hillshade (1-m)
- Various standard vegetation metrics (5-m and 25-m), such as 95th percentile height, canopy closure, rumple index, and variation in return heights
Online Spatial Data
Spatial data in gridded and vector formats are available for HJ Andrews Experimental Forest at the ArcGIS Open Data Hub. Spatial data that reside on the Hub include: hydrography data, historical imagery, LIDAR derived elevation models and base GIS layers such as roads.

Aerial Photography
Digital (and hardcopy) aerial photographs (9x9 format) are available for the HJ Andrews for the following years:
-
1946, 1949, 1959, 1967, 1972, 1979, 1990, 1996
Make arrangements with our Information Managers for access to the aerial photographs.
Digital Orthophotography
A digital orthophoto quadrangle (DOQ) is a computer-generated image of an aerial photograph in which image displacement caused by terrain relief and camera tilts has been removed. It combines the image characteristics of a photograph with the geometric qualities of a map. The imagery can be used within a Geographic Information System (GIS) because it has been geo-referenced to the earth surface.
There are historical orthophotos available for the HJ Andrews Experimental Forest, for the following years: 1959, 1967, 1979, and 1990. These orthophotos were generated using the 2008 LiDAR Digital Elevation Model (DEM), and aerial photography. Contact our Information Managers for access to these images. Oregon Statewide aerial imagery is available on-line for 1995, 2000, 2005, and 2009 at the Oregon Explorer.