
Image Search
| Thumbnail | Media name | Gallery | Keyword Tags | Caption | Photographed date Sort ascending |
|---|---|---|---|---|---|
|
aex_017.jpg | Stream Invertebrate Sampling 2021 | The stream in Watershed 2 |
||
|
aex_018.jpg | Stream Invertebrate Sampling 2021 | The stream in Watershed 2 |
||
|
aex_019.jpg | Stream Invertebrate Sampling 2021 | Researchers in Watershed 2, sampling for stream invertebrates |
||
|
aex_020.jpg | Stream Invertebrate Sampling 2021 | Researchers in Watershed 2, sampling for stream invertebrates |
||
|
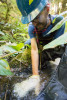
aex_021.jpg | Stream Invertebrate Sampling 2021 | Biological Diversity, Stream Ecology | Bill Gerth uses his hand to gently disturb the stream bottom and dislodge stream invertebrates as the water flows into the Surber net |
|
|
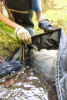
aex_022.jpg | Stream Invertebrate Sampling 2021 | Biological Diversity, Stream Ecology | Streamwater flows into the Surber sampler which catches stream invertebrates |
|
|
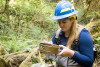
aex_023.jpg | Stream Invertebrate Sampling 2021 | OSU Undergraduate student Meagan White inspects the sample in a sieve |
||
|
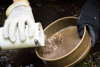
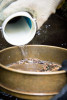
aex_024.jpg | Stream Invertebrate Sampling 2021 | Biological Diversity, Stream Ecology | The Surber sample cup is emptied into a sieve |
|
|
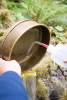
aex_025.jpg | Stream Invertebrate Sampling 2021 | Biological Diversity, Stream Ecology | The Surber sample cup is emptied into a sieve |
|
|
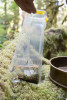
aex_026.jpg | Stream Invertebrate Sampling 2021 | All sample materials from the sieve are washed into the sample bag for preservation. Samples are sorted and insects identified at a later time. |
||
|
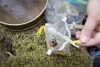
aex_027.jpg | Stream Invertebrate Sampling 2021 | Biological Diversity, Stream Ecology | The preserved sample from the Surber sampler, with detritus and stream invertebrates |
|
|
aex_028.jpg | Stream Invertebrate Sampling 2021 | Biological Diversity, Stream Ecology | The preserved sample from the Surber sampler, with detritus and stream invertebrates |
|
|
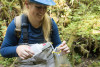
aex_029.jpg | Stream Invertebrate Sampling 2021 | Meagan White adds ethanol to the sample bag before sealing it |
||
|
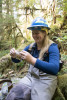
aex_030.jpg | Stream Invertebrate Sampling 2021 | Sealing the preserved sample |
||
|
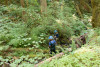
aex_031.jpg | Stream Invertebrate Sampling 2021 | Researchers in the stream in Watershed 2, sampling for stream invertebrates |
||
|
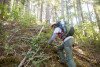
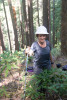
afg_001.jpg | Dendroecology 2022 | In the foreground, student researcher April Hersey climbs a steep slope to reach trees in the study plot. In the background, student researcher Aaron Evans assesses the diameter at breast height (DBH) of a tree. |
||
|
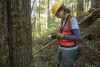
afg_002.jpg | Dendroecology 2022 | Dr. Catalina Segura at the HJ Andrews Experimental Forest. |
||
|
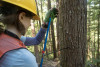
afg_004.jpg | Dendroecology 2022 | Undergraduate researcher April Hersey records the species and tag number of the tree that she is about to core. The tag number will allow the researchers to look up additional data about these trees from long-term dataset on tree growth and mortality. |
||
|
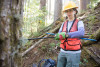
afg_005.jpg | Dendroecology 2022 | Research Experience for Undergraduates (REU) student April Hersey cores a tree in the HJ Andrews Experimental Forest. |
||
|
afg_006.jpg | Dendroecology 2022 | Research Experience for Undergraduates (REU) student April Hersey cores a tree in the HJ Andrews Experimental Forest. |
||
|
afg_007.jpg | Dendroecology 2022 | Research Experience for Undergraduates (REU) student Aaron Evans cores a tagged tree within an extended reference stand plot in the HJ Andrews Experimental Forest. |
||
|
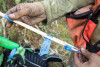
afg_008.jpg | Dendroecology 2022 | In the field, tree cores are temporarily stored in plastic straws and labeled with location, year, stand number, tree species, and a unique ID for the tree. |
||
|
afg_009.jpg | Dendroecology 2022 | Research Experience for Undergraduates (REU) student Aaron Evans looks at potential trees to core at the HJ Andrews Experimental Forest. |
||
|
afg_010.jpg | Dendroecology 2022 | Research Experience for Undergraduates (REU) student April Hersey prepares herself to core a tree in the HJ Andrews Experimental Forest. |
||
|
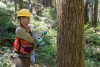
afg_011.jpg | Dendroecology 2022 | Research Experience for Undergraduates (REU) student Aaron Evans cores a tree in the HJ Andrews Experimental Forest. The borer (0.5cm in diameter) extract a small section of wood from tree trunk: the core. |
||
|
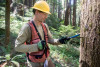
afg_012.jpg | Dendroecology 2022 | Research Experience for Undergraduates (REU) student Aaron Evans cores a tree in the HJ Andrews Experimental Forest. The borer (0.5cm in diameter) extract a small section of wood from tree trunk: the core. |
||
|
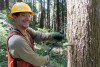
afg_013.jpg | Dendroecology 2022 | Research Experience for Undergraduates (REU) student Aaron Evans cores a tree in the HJ Andrews Experimental Forest. The borer (0.5cm in diameter) extract a small section of wood from tree trunk: the core. |
||
|
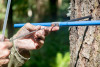
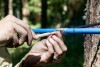
afg_014.jpg | Dendroecology 2022 | An REU student extracts a core from a tree using a tree ring borer. In the picture the outermost part of the core (the bark) is being extracted. |
||
|
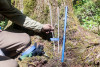
afg_015.jpg | Dendroecology 2022 | The tree core is slipped into a plastic straw for safe storage. It will be labeled and taken to a laboratory for further study. |
||
|
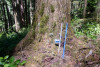
afg_016.jpg | Dendroecology 2022 | Two labeled tree core samples (left) were extracted per tree, and the coring tool (blue borer). |
||
|
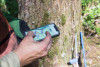
afg_017.jpg | Dendroecology 2022 | Two labeled tree core samples (left) and the coring tool (blue borer). |
||
|
afg_018.jpg | Dendroecology 2022 | Research Experience for Undergraduates (REU) student Aaron Evans reviews the study plot map on his smartphone using a GPS app. Sampled trees show up as points on the map. |
||
|
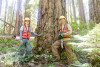
afg_019.jpg | Dendroecology 2022 | Research Experience for Undergraduate (REU) students April Hersey (left) and Aaron Evans (right) at the HJ Andrews Experimental Forest. |
||
|
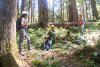
afg_020.jpg | Dendroecology 2022 | Dr. Catalina Segura (left), Aaron Evans (middle), and April Hersey (right). |
||
|
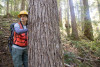
afg_003.jpg | Dendroecology 2022 | REU students April Hersey (L) and Aaron Evans (R) identify trees to be cored for a study on vegetation dynamics. The cores will allow researchers to learn more about trends in radial growth and climate-growth relationships over time. |
||
|
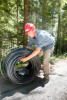
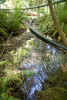
afh_001.jpg | Drought Experiment 2022 | Dr Dana Warren unfurls a large spool of 1/2 inch irrigation tubing used in the warming portion of the study |
||
|
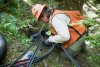
afh_002.jpg | Drought Experiment 2022 | The dewatering experiment involves using irrigation tubing to circumvent a section of stream. This is the discharge reduction reach with 4" bypass tubing |
||
|
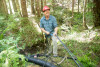
afh_003.jpg | Drought Experiment 2022 | Undergraduate technician Casey Warburtun organizes tubing |
||
|
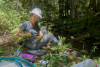
afh_004.jpg | Drought Experiment 2022 | Dr Dana Warren, a stream ecologist, is part of the research team trying to understand the effects of drought and warming on streams |
||
|
afh_005.jpg | Drought Experiment 2022 | Dr Catalina Segura, a geomorphologist, is part of the research team trying to understand the effects of drought and warming on streams |
||
|
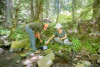
afh_006.jpg | Drought Experiment 2022 | Graduate student Allison Swartz (left) and faculty researcher Catalina Segura (right) ready the pump which will move streamwater through coils of black tubing |
||
|
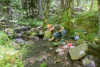
afh_007.jpg | Drought Experiment 2022 | Graduate student Allison Swartz inspects the pump and hose used to initiate the siphons for the warming lines. Water will be pulled from this section of the stream, warmed through black tubing sitting in the sun, and then deposited back into the stream |
||
|
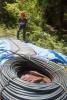
afh_008.jpg | Drought Experiment 2022 | coils of black tubing and a repurposed air mattress hold the stream water and warm it in the sunshine |
||
|
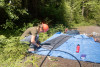
afh_009.jpg | Drought Experiment 2022 | coils of black tubing and a repurposed air mattress hold the stream water and warm it in the sunshine |
||
|
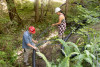
afh_010.jpg | Drought Experiment 2022 | Dr. Dana Warren (left) and Dr Lenka Kuglerova (right), a visiting scientist from Umeå University in Sweden, organize and place tubing for the experiment |
||
|
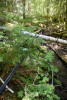
afh_011.jpg | Drought Experiment 2022 | the warming lines (1/2 inch irrigation tubing) follow the streambed and will eventually empty into a section downstream |
||
|
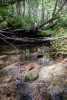
afh_012.jpg | Drought Experiment 2022 | the experimental drought reach of the experiment |
||
|
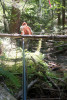
afh_013.jpg | Drought Experiment 2022 | A student researcher pulls the warming tubing through the study area |
||
|
afh_014.jpg | Drought Experiment 2022 | An undergradate researcher, Casey Warburtun, runs the warming tubing over the stream discharge reduction reach down to the warming reach |
||
|
afh_015.jpg | Drought Experiment 2022 | the study area of the dewatering and drought experiment |
||
|
afh_016.jpg | Drought Experiment 2022 | Undergraduate researcher Casey Warburton (front) and graduate student Allison Swartz (back) run the 1/2 irrigation warming lines past the low-flow reach to the warming reach. |
||
|
afh_017.jpg | Drought Experiment 2022 | Marking the different warming irrigration lines |
||
|
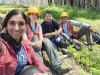
afg_023.jpg | Dendroecology 2022 | Left to right: PhD student Paola Arroyo Vargas and undergraduate researchers April Hersey, Desmond Willson, and Aaron Evans after a day of field work in the burned area at the HJ Andrews Experimental Forest. |
||
|
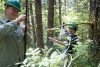
afi_001.jpg | Bird Study 2022 | Graduate student Madison Sutton (left) and field technician Haley Martens (right) prepare a mist net |
||
|
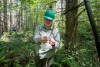
afi_002.jpg | Bird Study 2022 | Graduate student Madison Sutton untangles and readies a mist net |
||
|
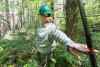
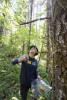
afi_003.jpg | Bird Study 2022 | Graduate student Madison Sutton installs a mist net |
||
|
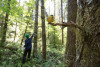
afi_004.jpg | Bird Study 2022 | Field technician Haley Martens places bird decoys near the mist net |
||
|
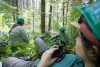
afi_005.jpg | Bird Study 2022 | Decoy birds are placed around the mist net to lure birds into the mist net |
||
|
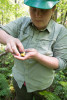
afi_006.jpg | Bird Study 2022 | After the mist net is installed reearchers sit quietly and watch for birds to fly into the net |
||
|
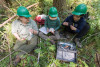
afi_007.jpg | Bird Study 2022 | A Hermit Wabler is captured in the net and gently removed for measurements before being released |
||
|
afi_008.jpg | Bird Study 2022 | Researchers measure the health and breeding status of each netted bird before releasing the birds |
||
|
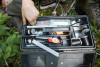
afi_009.jpg | Bird Study 2022 | Tools of the trade |
||
|
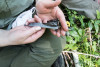
afi_010.jpg | Bird Study 2022 | A ruler is used to measure wing length |
||
|
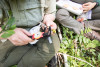
afi_011.jpg | Bird Study 2022 | Calipers are used to measure the length of the tarsus, or leg bone |
||
|
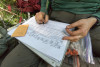
afi_012.jpg | Bird Study 2022 | Data for each bird is recorded on paper and then entered into a computer |
||
|
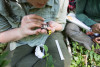
afi_013.jpg | Bird Study 2022 | By blowing on the bird's chest researchers can see fat and cloacal development to measure health and breeding phenology |
||
|
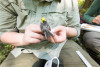
afi_014.jpg | Bird Study 2022 | Tail feathers are inspected for wear and tear |
||
|
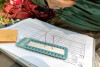
afi_015.jpg | Bird Study 2022 | Tiny blood samples are taken from the bird and are put through genomic analysis to determine bird health |
||
|
afi_016.jpg | Bird Study 2022 | Data for each bird is recorded on paper and then entered into a computer |
||
|
afi_017.jpg | Bird Study 2022 | After the data on the birds are recorded the birds are released back into the wild, unharmed, and the nets are removed. |
||
|
afg_021.jpg | Dendroecology 2022 | Researchers survey trees in Reference Stand 2 as they plan for a dendroecology study |
||
|
afg_022.jpg | Dendroecology 2022 | Researcher Dr. Andres Holz with a tagged tree in Reference Stand 2 |
||
|
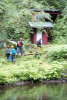
aff_001.jpg | Soil Hydrology WS2 2022 | Researchers arrive at Watershed 2 to install soil pits in the hillslope along the stream. |
||
|
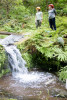
aff_002.jpg | Soil Hydrology WS2 2022 | Field technicians Bailey Brockamp (right) and India Gerhardt (left) take a break near the Watershed 2 flume. |
||
|
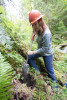
aff_003.jpg | Soil Hydrology WS2 2022 | Field technician Bailey Brockamp digs a soil pit for sensor installation. |
||
|
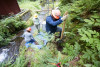
aff_004.jpg | Soil Hydrology WS2 2022 | Field technicians work to dig soil pits near the Watershed 2 gauge station. |
||
|
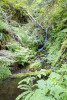
aff_005.jpg | Soil Hydrology WS2 2022 | Experimental Watershed 2 before entering the flume and sediment basin. |
||
|
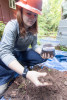
aff_006.jpg | Soil Hydrology WS2 2022 | Field technician Bailey Brockamp collects a soil sample for laboratory analysis. |
||
|
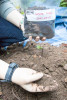
aff_007.jpg | Soil Hydrology WS2 2022 | A soil sample is collected in Watershed 2 for laboratory analysis. |
||
|
aff_008.jpg | Soil Hydrology WS2 2022 | Field equipment displaying the logo of Catalina Segura's Watershed Processes Laboratory. |
||
|
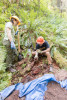
aff_009.jpg | Soil Hydrology WS2 2022 | Field technician India Gerhardt (left) and graduate student Zachary Perry (right) work on digging a soil pit for instrumentation. |
||
|
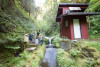
aff_010.jpg | Soil Hydrology WS2 2022 | Researchers at work in Watershed 2. |
||
|
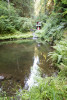
aff_011.jpg | Soil Hydrology WS2 2022 | The sediment basin and flume of Watershed 2 |
||
|
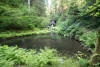
aff_012.jpg | Soil Hydrology WS2 2022 | The sediment basin and flume of Watershed 2 |
||
|
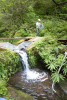
aff_013.jpg | Soil Hydrology WS2 2022 | Field technician India Gerhardt prepares conduit for soil sensor cables near the Watershed 2 flume. |
||
|
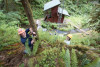
aff_014.jpg | Soil Hydrology WS2 2022 | Field technicians Casey Warburton (left) and India Gerhardt (right) install a data logger. |
||
|
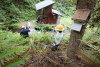
aff_015.jpg | Soil Hydrology WS2 2022 | Undergraduate students Casey Warburton (front) and India Gerhardt (back) run sensor cables through conduit. |
||
|
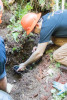
aff_016.jpg | Soil Hydrology WS2 2022 | Graduate student Zachary Perry installs a soil moisture sensor. |
||
|
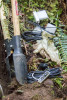
aff_017.jpg | Soil Hydrology WS2 2022 | Field equipment used to install soil moisture sensors. |
||
|
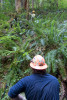
aff_018.jpg | Soil Hydrology WS2 2022 | Field technicians Casey Warburton (left) and India Gerhardt (right) run sensor cables through conduit. |
||
|
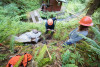
aff_019.jpg | Soil Hydrology WS2 2022 | Field technicians dig a soil pit in Watershed 2 for soil sensor instrumentation. |
||
|
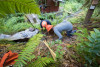
aff_020.jpg | Soil Hydrology WS2 2022 | Field technicians dig a soil pit in Watershed 2 for soil sensor instrumentation. |
||
|
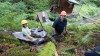
aff_021.jpg | Soil Hydrology WS2 2022 | Field technicians India Gerhardt (left) and Casey Warburton (right) dig a soil pit in Watershed 2 for soil sensor instrumentation. |
||
|
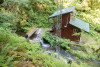
aff_022.jpg | Soil Hydrology WS2 2022 | Graduate student Zachary Perry in Watershed 2 of the HJ Andrews Experimental Forest |
||
|
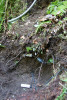
aff_023.jpg | Soil Hydrology WS2 2022 | Soil sensors installed in the wall of a soil pit in Watershed 2. |
||
|
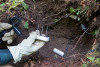
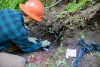
aff_024.jpg | Soil Hydrology WS2 2022 | A soil moisture sensor. The probes go into the soil and measure volumetric water content along with other data. |
||
|
aff_025.jpg | Soil Hydrology WS2 2022 | Graduate student Zachary Perry installs a soil moisture sensor. |
||
|
aff_026.jpg | Soil Hydrology WS2 2022 | Soil moisture sensors ready to be installed in soil pits. |
||
|
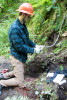
aff_027.jpg | Soil Hydrology WS2 2022 | Graduate student Zachary Perry runs soil moisture sensor cables through aluminum conduit. |
||
|
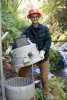
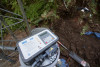
aff_028.jpg | Soil Hydrology WS2 2022 | Graduate student Zachary Perry with an ISCO water sampler in Watershed 2. |
||
|
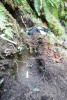
aff_029.jpg | Soil Hydrology WS2 2022 | An ISCO automated water sampler. |
||
|
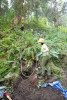
aff_030.jpg | Soil Hydrology WS2 2022 | Soil moisture sensors installed and ready to connect to the data logger. |
||
|
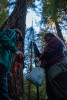
aff_031.jpg | Soil Hydrology WS2 2022 | Aluminum conduit is used to protect soil moisture sensor cables from rodents as it runs along the ground to the data logger. |
||
|
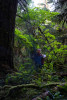
afi_018.jpg | Bird Study 2022 | Researchers set up and open the mist net, used to safely capture birds |
||
|
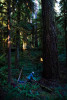
afi_019.jpg | Bird Study 2022 | Graduate student Madison Sutton stretches the mist net through an opening in the forest |
||
|
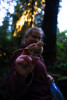
afi_020.jpg | Bird Study 2022 | Researchers set up and stretch out the mist net, used to gently capture birds |
||
|
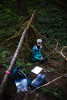
afi_021.jpg | Bird Study 2022 | Bird decoys are set up near the mist net to lure in curious or territorial birds |
||
|
afi_022.jpg | Bird Study 2022 | Field technician Haley Martens sits quietly to wait for birds to fly into the mist net |
||
|
afi_023.jpg | Bird Study 2022 | A Swainson's Thrush in the mist net |
||
|
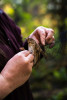
afi_024.jpg | Bird Study 2022 | Birds are safely removed from the mist net and are held for data collection and measurements before being released |
||
|
afi_025.jpg | Bird Study 2022 | A tiny aluminium band with a unique ID number is placed on the leg of the bird |
||
|
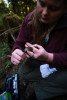
afi_026.jpg | Bird Study 2022 | A tiny aluminium band with a unique ID number is placed on the leg of the bird |
||
|
afi_027.jpg | Bird Study 2022 | Calipers are used to measure the length of the tarsus, or leg bone |
||
|
afi_028.jpg | Bird Study 2022 | Madison Sutton measures health of the newly banded birds by blowing on the bird's abdomen to measure fat and breeding phenology. |
||
|
afi_029.jpg | Bird Study 2022 | Flight feathers are assessed for wear and tear |
||
|
afi_030.jpg | Bird Study 2022 | The bird is placed into a cotton bag and is weighed |
||
|
afi_031.jpg | Bird Study 2022 | After all measurements, the bird is released, unharmed, into the area where it was captured |
||
|
afi_032.jpg | Bird Study 2022 | The mist net stretches across an opening in the forest |
||
|
afi_033.jpg | Bird Study 2022 | A guage is used to measure the diameter of the leg of a bird and determine the correct band size |
||
|
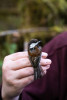
afi_034.jpg | Bird Study 2022 | A Chestnut-backed Chickadee is placed into a cloth bag and weighed on a scale. This guy weighed about 8 grams. That's like 8 paperclips. |
||
|
afi_035.jpg | Bird Study 2022 | A Chestnut-backed Chickadee just before release |
||
|
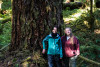
afi_036.jpg | Bird Study 2022 | Field technician Halay Martens (left) and graduate student Madison Sutton (right) at the HJ Andrews Experimental Forest |
||
|
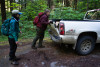
afi_037.jpg | Bird Study 2022 | Packing up the truck after a day of field work |
||
|
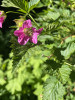
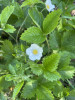
afq_027.JPEG | Scenery and nature photos 2022-2023 | Rubus sp. in flower |
||
|
afq_028.JPEG | Scenery and nature photos 2022-2023 | Fragaria sp. in flower |
||
|
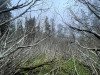
afq_025.JPEG | Scenery and nature photos 2022-2023 | Alder thicket on a spring morning. |
||
|
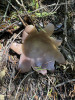
afq_024.JPEG | Scenery and nature photos 2022-2023 | Sarcosphaera fungus opening in the forest duff. |
||
|
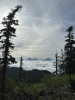
afq_002.JPEG | Scenery and nature photos 2022-2023 | North, Middle, and South Sister sitting above the clouds, taken from Lookout Mountain |
||
|
afq_023.JPEG | Scenery and nature photos 2022-2023 | Rhododendron macrophyllum blooming in the understory of old-growth |
||
|
afq_014.JPEG | Scenery and nature photos 2022-2023 | Waterfall flowing down mossy bedrock in Watershed 2. |
||
|
afq_021.JPEG | Scenery and nature photos 2022-2023 | Lichens growing on old-growth Douglas Fir branches. |
||
|
afq_020.JPEG | Scenery and nature photos 2022-2023 | Fairy Slipper (Calypso bulbosa) |
||
|
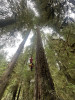
afq_019.JPEG | Scenery and nature photos 2022-2023 | Forest Director, Mark Schulze climbing an old-growth Douglas Fir tree to install microclimate sensors. |
||
|
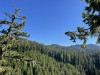
afq_026.JPEG | Scenery and nature photos 2022-2023 | Upper Lookout Valley from 80 meters in the canopy of an old-growth Douglas Fir tree. |
||
|
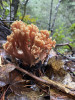
afq_017.JPEG | Scenery and nature photos 2022-2023 | Coral fungus in Watershed 2 |
||
|
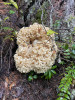
afq_018.JPEG | Scenery and nature photos 2022-2023 | Cauliflower fungus in Watershed 2 |
||
|
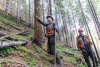
afa_007.jpg | Vegetation survey after wildfire 2021 | Field crew on the steep slope of WS1 burned in the Holiday Farm fire |
||
|
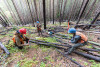
afa_009.jpg | Vegetation survey after wildfire 2021 | Field crew re-establishes vegetation study plots that were burned on the steep slope of WS1 |
||
|
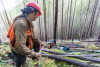
afa_010.jpg | Vegetation survey after wildfire 2021 | Field crew re-establishes vegetation study plots that were burned on the steep slope of WS1 |
||
|
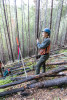
afa_011.jpg | Vegetation survey after wildfire 2021 | Field technician Lauren Dorsch in Watershed 1 |
||
|
afa_033.jpg | Vegetation survey after wildfire 2021 | Field technician Lauren Dorsch in Watershed 1 |
||
|
afa_034.jpg | Vegetation survey after wildfire 2021 | Field technician Lauren Dorsch in Watershed 1 |
||
|
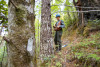
afa_036.jpg | Vegetation survey after wildfire 2021 | Field crew remeasures vegetation in a permanent study plot |
||
|
afa_037.jpg | Vegetation survey after wildfire 2021 | Field crew remeasures vegetation in a permanent study plot |
||
|
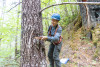
afa_038.jpg | Vegetation survey after wildfire 2021 | Field crew remeasures vegetation in a permanent study plot |
||
|
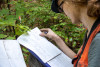
afa_039.jpg | Vegetation survey after wildfire 2021 | Field technician Lauren Dorsch measures tree diameter |
||
|
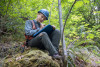
afa_045.jpg | Vegetation survey after wildfire 2021 | Field technician Lillian Evergreen records data on vegetation |
||
|
afa_046.jpg | Vegetation survey after wildfire 2021 | Field technician Lauren Dorsch records data on vegetation |
||
|
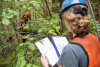
afa_048.jpg | Vegetation survey after wildfire 2021 | Field crew takes note of species type and vigor of plants in the study plots |
||
|
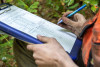
afa_049.jpg | Vegetation survey after wildfire 2021 | Field technician Lillian Evergreen records data on vegetation |