(Al Levno 1994)
Don Henshaw,
U.S. Forest Service Pacific Northwest Research Station, 3200 SW Jefferson, Corvallis, OR 97331
Fred Bierlmaier
Forest Science Department, Oregon State University, Corvallis, OR 97331
Hazel Hammond
U.S. Forest Service Pacific Northwest Research Station, 3200 SW Jefferson, Corvallis, OR 97331
Presented August 9, 1997, Albuquerque, New Mexico, at the workshop on
Data and Information Management in the Ecological Sciences: A Resource Guide
Abstract. Research modeling in ecology and hydrology demands the collection of short time-step, spatially distributed climatic measurements. Standardized sets of measured parameters with standard collection methods are critical for comparability of measurements. Standard data archival formats, quality assurance procedures, and good mechanisms for method documentation are essential for efficient handling of large quantities of electronic data. Web access to near real- time climatological data as well as long-term archives has proven invaluable to researchers.
|
|
PowerPoint Presentation
Introduction
Historical Perspective/Background
Meteorological Databases and Metadata
Quality Assurance (QA)
Data Access
Conclusion
Acknowledgements
Literature Cited
Research modeling and other spatial studies in hydrology and ecology are putting increasing demands on long-term measurement collection systems. The advancement of remote sensing and Geographical Information System (GIS) technology has spurred the development of spatially distributed ecosystem study models requiring short time-step, spatially-distributed measurements to understand processes and test hypotheses at different scales. Coordinated climatological field measurements programs with standardized collection methods, quality assurance procedures, and data archival formats are necessary to meet the needs of multidisciplinary programs. Long-term measurements of climatological variables at various temporal and spatial scales provide a necessary foundation for understanding ecosystem processes and documenting environmental changes (Greenland 1993).
Technical advances in climatological instrumentation such as meteorological sensors, data loggers, and telecommunications allow for routine measurement of critical climatological parameters at high spatial and temporal scales. Collection of vast amounts of data with improved accuracy is now possible, but quality assurance of this data is not guaranteed without significant changes in field measurement programs. Field collection techniques, quality assurance procedures, and data processing and archival systems must evolve to meet the demands of quickly growing data collection efforts. Documentation of the methodologies and archival formats are necessary for the long-term survival and usefulness of this information.
Researchers also wish to take advantage of new web and telemetry technologies to gain near real-time access to critical stream and weather conditions. Access to climatic summary data is also requested shortly after significant weather events. Computer systems employing telemetry and web technology provide researchers remote access to raw weather data and a basis to determine the necessity of a site visit (eg., for purposes of storm sampling). Telemetry also provides technicians a way to monitor the operation and accuracy of these remote stations.
Historical Perspective/Background:
The hydroclimatological measurements program of the H. J. Andrews Experimental Forest LTER site started in 1952. The existing system evolved as an accumulation of measurement programs with various designs, and objectives in response to individual projects and scientist interests (Rothacher et al. 1967, Emmingham and Lundberg 1977, Waring et al. 1978). Until recently, most of the meteorological data collection had been driven by very site specific questions. Climatic stations as well as precipitation and temperature networks were established independently. Field techniques, collection methods, data handling procedures, and the parameters measured were highly variable among measurement sites. In the early 1990�s it became clear that new objectives for the hydroclimatological measurements program had superseded many of the original objectives and would require a more comprehensive network design and new instrumentation ( Henshaw et al. 1995).
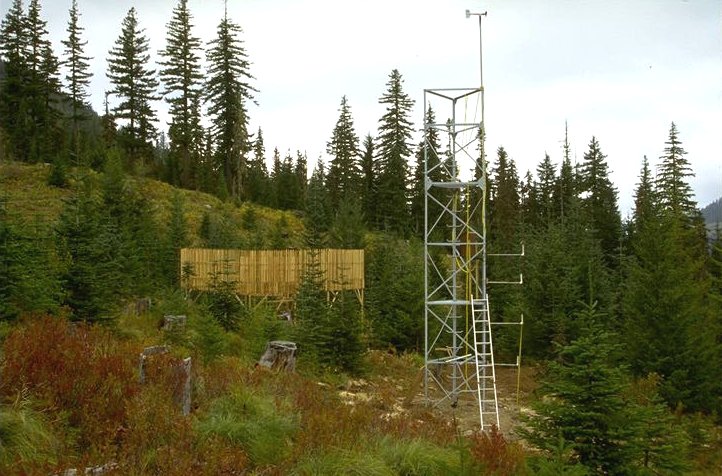
Much of the Andrews Forest occupies rugged terrain with steep mountain slopes and extensive conifer stands. The elevation range of 420 to 1630 m makes most of the forest accessible only by snowcat during most winters. This has traditionally limited the ability to find suitable, accessible sites for meteorological measurement, and especially precipitation measurement. To overcome the limited environmental representativeness of our measurement system, two new additional weather stations were built to give the forest four comprehensive "benchmark" meteorological stations (See site map). Additionally a system of second-level stations are strategically located to examine spatial variability of precipitation, air, soil, and stream temperature along environmental gradients. Radio telemetry was established at the �benchmark� stations and selected stream gaging stations to create a "virtual" accessibility to these remote sites.
Modifications to standardize the variables measured, temporal resolution, collection methodology, sensor heights, and instrumentation were made to both new and existing stations. Quality assurance/quality control procedures as well as data archival formats and procedures were also modified and standardized. To track changes in instrumentation and methodology, collection time resolution, and sensor heights, as well as fully document problems encountered with meteorological measurement, a database schema for this metadata was established (See Figure 1).
Meteorological Databases and Metadata
The Forest Science Data Bank (FSDB) has been actively involved with managing hydrological, meteorological, and other related data for the Andrews LTER for over twenty years ( Stafford et al. 1986). Due to the piecemeal evolution of the measurement program, separate databases and data formats were established for these independent efforts. For example, climatic stations collected different sets of variables and were structured in separate databases. The precipitation network and thermograph network also were independent databases. To prepare for the increasing influx of electronically collected data, databases were standardized for all meteorological data collected on the Andrews. This standardization has greatly simplified processing methods by allowing the use of standard programs to do quality assurance checking on all meteorological data. An added benefit is ability to automatically create web pages for access to this data.
Within the Forest Science Data Bank (FSDB) every data set table has an associated metadata file that 1) describes the table�s variables (attributes) including each variable name, definition, units, and domain (data type and format); 2) indicates whether the variable is coded; and 3) describes attribute information critical for generic quality assurance checking such as a) whether a variable can be null, b) is a primary key, and c) shows the common variable range ( Spycher et al 1996). When attributes are listed as coded, a second metadata file lists all coded variables, all valid codes, and code definitions. The meteorological data takes advantage of these metadata files to document the common database structures and properly define the measurement variables. Table 1 lists the independent tables that are established for the measurement parameters. Separate tables are maintained for daily and higher temporal resolution data.
All documentation or metadata regarding the hydroclimatological measurement system is stored and maintained by the FSDB. Records of all changes in field instrumentation, sensors, locations, sensor heights, and temporal resolutions are maintained for every measurement variable in a relational database schema ( See Figure 1). Tables within the schema include specific measurement site descriptions and the parameters measured at each station with spanning dates. Histories of changes in collection time resolutions, sensor heights, instrumentation, and encountered problems. To avoid redundant descriptions, independent tables are established to describe methods (with instrumentation) and encountered problems.
Electronic data collection provides a mechanism to collect immense quantities of data with very sophisticated measurement sensors and data loggers. Collection of meteorological data is commonly collected at 15 minute or hourly time intervals and sometimes with multiple sensors for each measurement parameter. This is a tremendous change from the historical data collection efforts which consisted primarily of digitized and manually read records from various recording charts and punch tapes, and hand recorded field notes. However, the transition to electronic data collection does not assure that the collected records are reliable and error-free, and the data requires extensive quality assurance (QA) checking. Also lost is the instantaneous feedback the field technician had when examining a chart in the field. This bird�s-eye view of seeing the overall graphical picture is replaced with a worm�s eye view of the data logger�s single discrete digital values.
In October, 1991, the LTER Data Managers conducted a survey on the use of electronic data collection instrumentation at the LTER sites ( Ingersoll and Chapal, 1992). It was discovered that most meteorological data are collected, stored, and transferred by electronic means at LTER sites ( This See survey table). The resultant survey responses provide an assessment of common problems and solutions encountered in electronic data collection and describe the QA procedures at the LTER sites. It is clear that while new electronic technologies have greatly reduced the need for manual data entry and digitizing, field techniques and QA protocols need to evolve to reduce the increasing chances of undetected problems residing in final data archives.
QA procedures for electronically collected data must involve field technicians, the site data manager, and the principle investigators to be most effective. Additionally, the ability to detect problems quickly provides more timely feedback to field technicians. The following summarizes some of the field procedures being used at the Andrews and other LTER sites to help provide quality assurance:
QA continues once the data reaches the laboratory. The Andrews LTER performs three types of programmatic quality assurance checks of electronically collected meteorological data.
Generic checking is performed on every data set in the FSDB by referencing the metadata to find and report potential problems in the data. Problems might include data values out of normal range, data values missing when �not null� is specified, use of improper codes (e.g., for coded variables such as data quality flags), and improper data structure or data format of ASCII files.
Special-rules checking specific to climate data include 1) checks for date and time validity and proper sequencing, 2) checks that minimum<=mean<=maximum when applicable, and 3) checks for proper placement of missing flags in the quality code fields. Computer code for implementing these special rules is maintained with the climatic metadata. Visual checking of data values is performed by 1) graphing a single parameter over time, 2) graphing redundant or multiple sensors for comparison, and 3) graphing related or associated parameters together. Examples include displaying a station�s mean, maximum, and minimum values over time in a moving time graph, creating scatter plots of the data of one site versus another, and displaying wind data in polar graph form. Models have also provided valuable insight into discovering inconsistencies in measurement sensors, e.g., snow hydrology models. (Duan and Grant 1997)
Once the quality assurance checking has been completed, there remain substantial questions in determining how problem data should be documented. The Andrews LTER data structures employ data quality flags for every measured value. Determining whether a value is tagged �questionable� or �missing� is very subjective. Inaccurate values showing a consistent bias may still have redeeming value and are typically coded �questionable� and retained. Very questionable data may be ultimately coded �missing� and discarded if no interpretation is possible. Since researchers and modelers often require that no values be �missing� over key time periods, these missing values will frequently be estimated. Most estimation techniques and equations are saved in the metadata, and values are tagged �estimated�. Field technician notebooks or logs with comments can be invaluable in evaluating problem data. A Comments database table is maintained to describe periods of flagged data and provides a useful log of problems and solutions.
Historical climatic and streamflow data were collected on strip charts, circular charts, punch tapes and hand-written check sheets. In the early 1980�s weather station technology allowed capture of our primary station�s data on a nearby computer at the Andrews headquarters (Bierlmaier and McKee 1989). However, all data was hand delivered to the Corvallis research facility, data processing took weeks and in some cases years, and researchers had no access to any real-time weather condition data. In 1993 a dedicated 56Kb direct network link was established greatly improving the connectivity of Andrews computers with the Corvallis research group�s local area network.
In 1995 radio telemetry capability was added to the remote benchmark stations and two stream gauging stations providing instantaneous access to remote weather stations ( See Figure 2). During a storm in February of 1996 when access to remote sites was impossible due to washed out roads, fallen trees, and flooding, radio telemetry provided data to researchers that would not otherwise have been available.
In 1996 a suite of Microsoft software. including Foxpro were used to develop programs for automatically accessing raw telemetry weather station data and processing the data into webpages accessible over the World Wide Web (http://hja.fsl.orst.edu/). This near real-time weather webpage is updated hourly in the winter and daily in the summer. All of the Andrews Forest LTER historical and current climate databases can be found on the WWW in the Data Catalog under Study Code MS001. All metadata files associated with this as well as the datasets themselves are written to HTML and ASCII files for web access.
As research modeling in ecology and hydrology demands the collection of short time- step, spatially distributed climatic measurements, coordination of climatological field measurement programs becomes very important. Standardized sets of measured parameters with standard collection methods are critical for comparability of measurements. Standard data archival formats, quality assurance procedures, and good mechanisms for method documentation are essential for efficient handling of large quantities of electronic data and their long-term usefulness. Web access to near real- time data has also proven invaluable to researchers in assessing remote site conditions.
Support for the H. J. Andrews climatological field measurement program is provided by the Pacific Northwest Research Station and the National Science Foundation grant DEB9632921. This paper benefited from discussions with Al Levno, Craig Creel, and Arthur McKee.
Bierlmaier, F. A., and W. A. McKee. 1989. Climatic summaries and documentation for the primary meteorological station, H.J. Andrews Experimental Forest, 1972 to 1984. Gen. Tech. Rep. PNW-242. Portland, OR: U.S. Department of Agriculture, Forest Service, Pacific Northwest Research Station.
Duan, J., and G. E. Grant. 1997. Modeling snow accumulation and melt in mountain watersheds. In Proceedings of the 13th Conference on Hydrology, American Meteorological Society, Feb. 2-5, 1997, Long Beach, CA.
Emmingham, W. H., and G. A. Lundburg. 1977. Climatic and physiological data summaries for the H.J. Andrews reference stand network. Seattle: University of Washington; Coniferous Forest Biome Internal Report 166.
Greenland, D. 1995. The Pacific Northwest Regional Context of the Climate of the H.J. Andrews Experimental Forest. Northwest Science. 69(2):81-93.
Henshaw, D. L., W. A. McKee, and A. Sikka. 1995. The Program for hydroclimatological Measurement at the H.J. Andrews Experimental Forest. [Online]. Available: /lter/research/component/climate/summary.cfm?sum=hjamet [1997, September 18].
Ingersoll, R., and S. Chapal. 1992. The Management of Electronically Collected Data within LTER. http://www.lternet.edu/cgi-bin/list.cgi?./Reports/Data-management-committee/Electronic-Data-report
Rothacher, J., C. T. Dyrness, and R. L. Fredriksen. 1967. Hydrologic and related characteristics of three small watersheds in the Oregon Cascades. Portland, OR: U.S. Department of Agriculture, Forest Service, Pacific Northwest Forest and Range Experiment Station.
Spycher, G., J. B. Cushing, D. L. Henshaw, S. G. Stafford, and N. Nadkarni. 1996. Solving problems for validation, federation, and migration of ecological databases. In: Global networks for environmental information: Proceedings of Eco-Informa '96. 1996 November 4-7; Buena Vista, FL. 11: 695-700. Ann Arbor, MI, Environmental Research Institute of Michigan (ERIM).
Stafford, S. G., P. B. Alaback, K. L. Waddell, and R. L. Slagle. 1986. Data management procedures in ecological research. In: Michener, William K., ed. Research data management in the ecological sciences. The Belle W. Baruch Library in Marine Science No. 16. Columbia, SC: University of South Carolina Press: 93-113.
Waring, R. H., R. H. Holbo, R. P. Bueb, and R. L. Fredriksen. 1978. Documentation of meteorological data from the Coniferous Forest Biome primary station in Oregon. Gen. Tech. Rep. PNW-73. Portland, OR: U.S. Department of Agriculture, Forest Service, Pacific Northwest Forest and Range Experiment Station.