![]()
![]() Results
Results ![]()
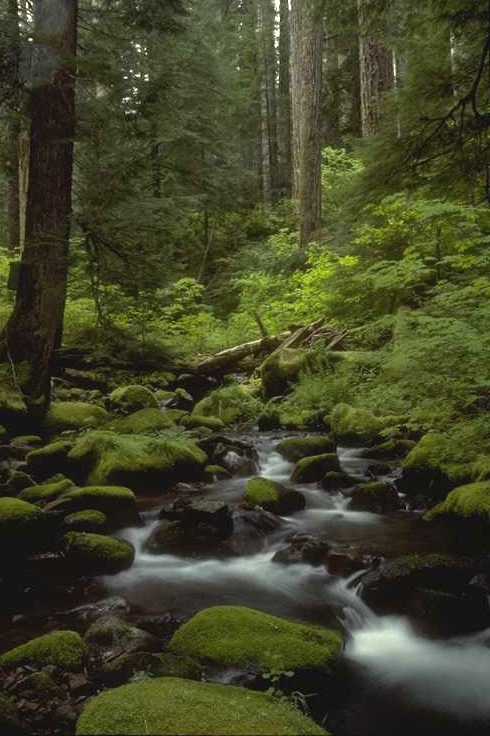
H. J. Andrews Experimental Forest, OR (photo by Al Levno)
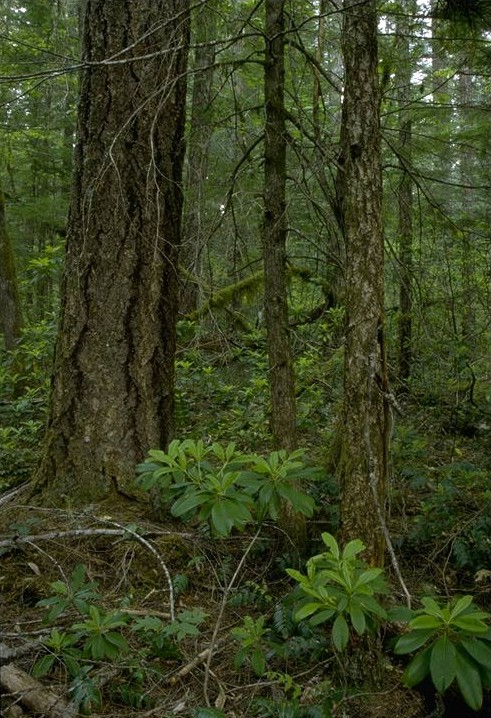
H. J. Andrews Experimental Forest, OR (photo by Al Levno)
A comparison
of decomposition rates derived from the chronosequence versus
decomposition vector methods indicates that for three of the best-studied
species (Abies concolor, Abies lasiocarpa, and Pinus contorta) the
rates are within 40% (Tables
3 and 4). Based
on the standard errors of the chronosequence decomposition rates, an
estimate of a decomposition rate within 20% of the chronosequence value
would be viewed as equivalent. In the case of a constant loss of mass the two
methods will give identical results (this was tested theoretically and
against the HJAF time series). However,
when decomposition is not a constant proportion each year, that is it
accelerates then slows down, the regression method may not detect the
period of rapid mass loss. This
indicates that the average rates of decomposition estimated by both the
chronosequence and decomposition vectors need to be taken as an
approximation and a non-linear model with a changing decomposition rate
may be required. This could
only be provided by a times series with multiple sample times (Table
5).
From this analysis it would be reasonable to assign uncertainty to
the estimates in the following order:
decomposition vector>chronosequence>>time series.
Based on all
the likely estimates (reasonable sample size, preference for regression
estimates, estimate value relative to similar species) of decomposition
rates it would appear that the decomposition rate of tree boles examined
could range an order of magnitude between 0.007 to 0.083 year-1 (Table
6). The two highest rates
were for Alnus, which ranged at the two sites it was examined from
0.055 to 0.083 year-1. Abies
at SQNP was estimated to have rates as high as 0.073 year-1 using
decomposition vectors, but a long-term average for
that site and species is more likely to be 0.051 year-1.
This would mean that the range for conifers is most likely to be
from 0.007 to 0.051 year-1.
The rates of
decomposition estimated generally correspond to the general classes of
decay resistance developed in forest products analysis (Table
7).
Conifer genera with very low decay resistance such as Abies
had decomposition rates ranging from 0.023 to 0.051 year-1.
However, for other genera with low decay resistance, there
was considerable variation with Picea ranging between 0.023 to
0.028 year-1 and yellow pines ranging between 0.011 and 0.042
year-1, and Tsuga being between 0.018 and 0.026 year-1.
The high range in yellow pines is suspect with the value for Pinus
ponderosa likely underestimated.
Pseudotsuga and white pine species, which have moderate
decay resistance, had decomposition rates ranging between 0.014 and 0.036
year-1. The two
genera with high decay resistance (Thuja and Calocedrus) had
decomposition rates ranging between 0.007 and 0.02 year-1.
In part the
range in decomposition rates within the decay resistance classes is likely
to be associated with variation in climates.
Plotting all the genera sampled at more than one site versus mean
annual temperature indicates that there is a general increase in
decomposition rate with temperature (Figure
7).
Abies, Pinus, Pseudotsuga, and Tsuga
all exhibit some increase with temperature, whereas Picea
does not. The decrease with
temperature in the latter genus may be related to the much wetter climate
at the warmer site. Discounting
the one genus that exhibited decreased decomposition with increased
temperature, it might be possible to make an adjustment for temperature
using a Q10 factor (i.e., the relative increase with a 10 C increase in
temperature. Typically a Q10
of 2 to 3 is assumed in biological models.
For Abies the Q10 would be approximately 1.5 and for Pinus
it would be 2.1 (Table
8). In contrast, for Pseudotsuga
and Tsuga the
Q10 was estimated to be 8.2 and 10.7, respectively. The
degree
that differences in moisture is confounding the temperature relationship
is not clear, but in the case of Pseudotsuga and Tsuga it is possible that, while
the WREF site is slightly cooler than CHEF or HJAF, it is effectively much
wetter. A comparison of Alnus
between
CHEF and HJAF indicates that even with similar temperature, it is possible
for a species to have very different decomposition rates. In this case, it seems likely that the wetter climate at CHEF
is decreasing the decomposition rate relative to HJAF. The same pattern, although to a lesser degree, can be seen in Tsuga
at these two sites.
There are also differences suggesting that the organisms decomposing the logs have a large impact on decomposition rate. For example, Abies consistently decomposes faster than Tsuga at a given temperature despite a very similar chemical composition and decay resistance. This may be may be related to the type of fungi degrading these species as Abies seems prone to white-rot and Tsuga to brown-rot fungi. At a minimum this indicates that early comparisons of climate effects that assumed Abies and Tsuga were similar are unlikely to be valid (e.g., Harmon et al. 1987).