|
|
|
|
|
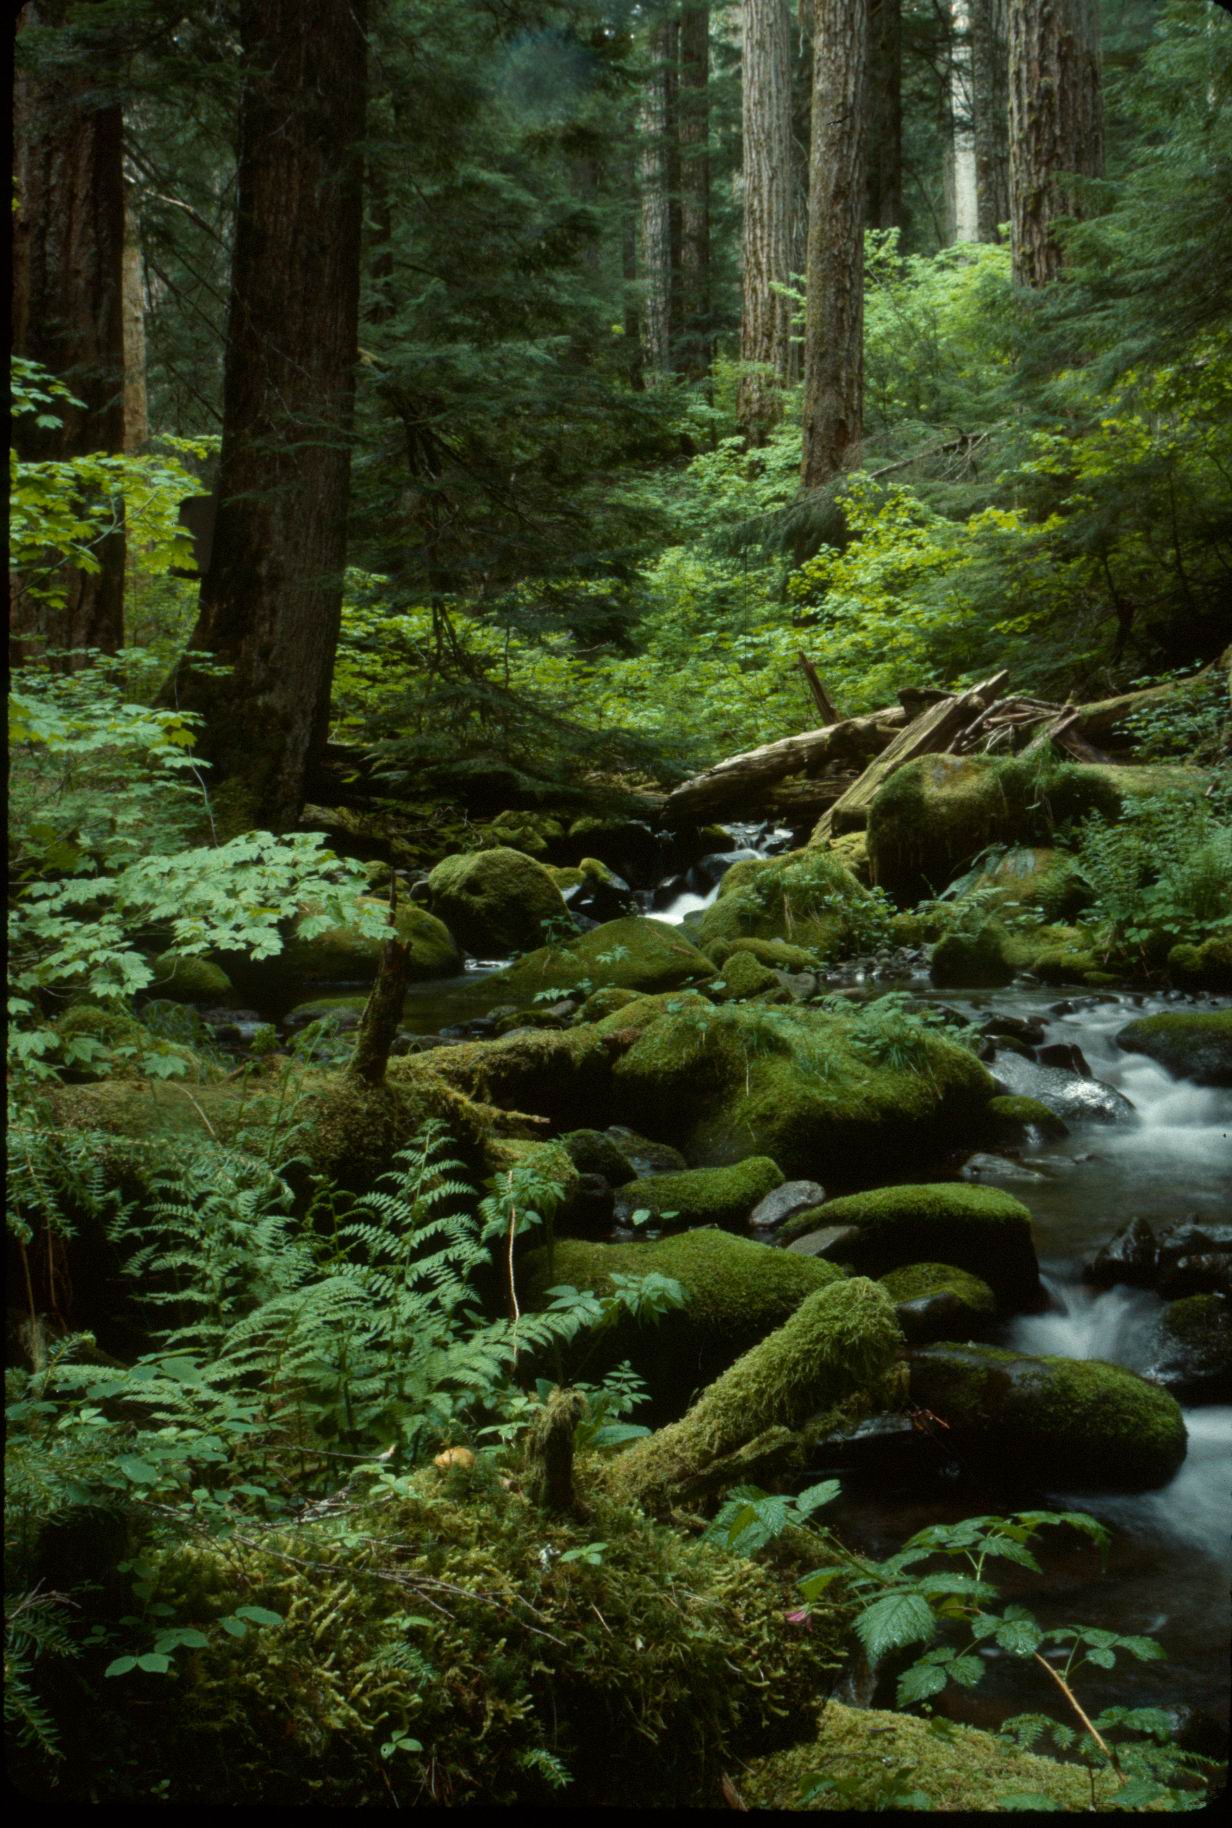
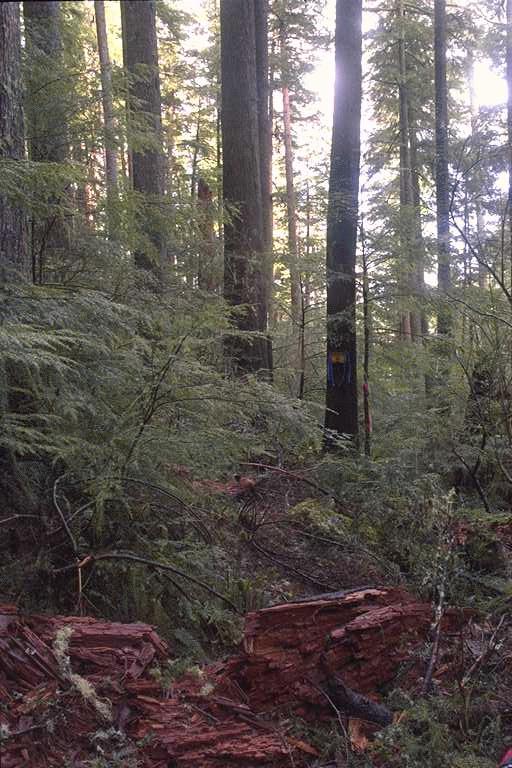
H. J. Andrews Experimental Forest
H. J. Andrews Experimental Forest, OR
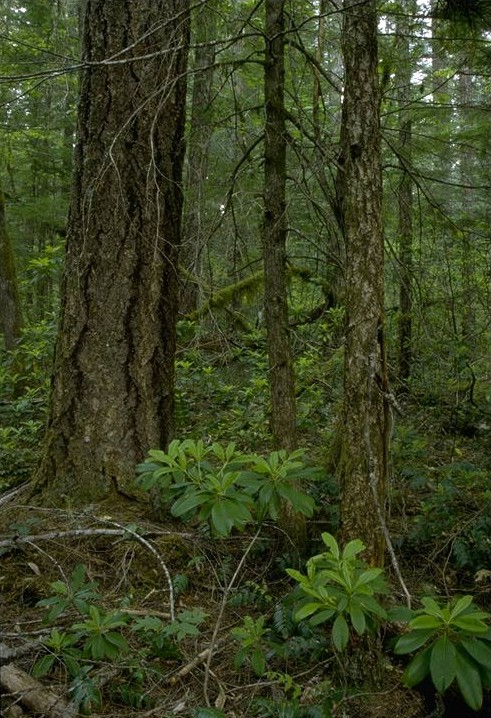
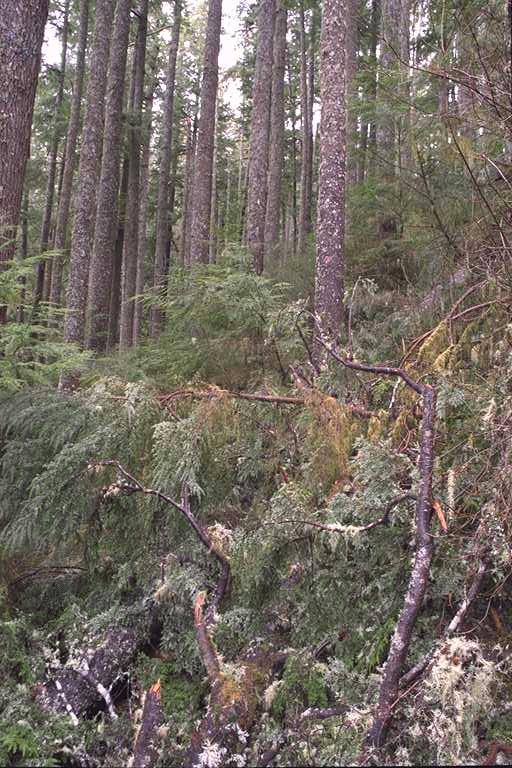
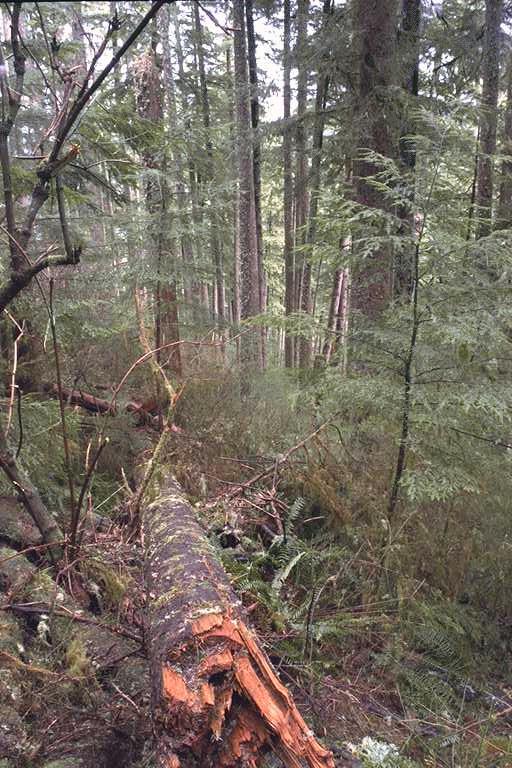
Cascade Head Experimental Forest, OR
Cascade Head Experimental Forest, OR
Cascade Head Experimental Forest, OR |
Figure 7. Decomposition rate versus temperature for genera sampled at more than one site.
Figure 2. Climate conditions of the sample sites.
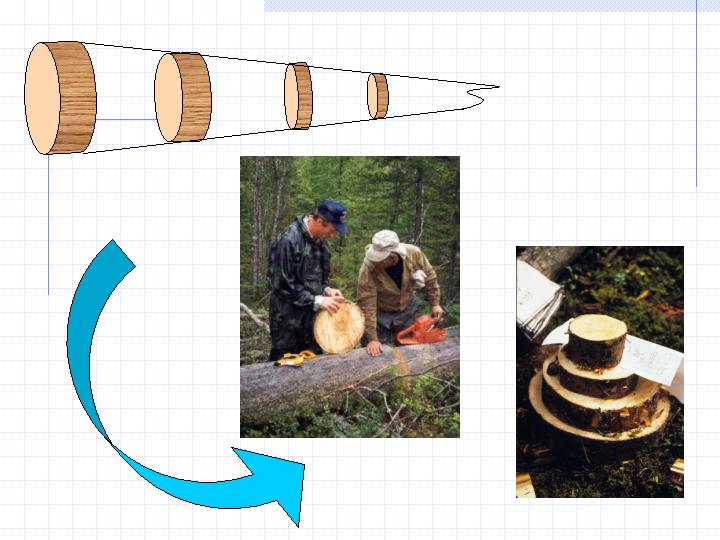
Figure
3. The process of log
sampling; cutting, measuring, and weighing.
Figure 4. Example of chronosequence data. Abies concolor from Sequoia N.P.
Figure 5. Example of time series data. Abies amabilis from H. J. Andrews Exp. Forest.
Figure 6. Example of decomposition vector. Abies concolor from Sequoia N.P.
Figure
7.
Decomposition rate versus temperature for
genera
sampled at more than one site.
|